
Quick answer: A baseline survey is a structured measurement of a target population's conditions taken before a project or programme begins. It records the starting value of every indicator the project hopes to change, such as income, school enrolment, water access or knowledge levels, so that later surveys can show what changed. A good baseline uses a proper sample, a piloted questionnaire, trained enumerators and a report that documents methods as carefully as results.
A baseline survey is the measurement every later claim of impact depends on. Any statement that a programme raised incomes, improved enrolment or changed practices is a comparison between "now" and "before", and the "before" comes from the baseline. If that starting point is missing, late or poorly measured, no amount of later data can repair it.
This guide explains the baseline survey meaning in plain terms, why projects commission one, what it measures, the steps from indicators to report, how to size the sample, a worked baseline survey example with illustrative numbers, and a baseline survey report format you can adapt. Topics that have their own detailed guides, such as questionnaire design, endline comparison and CSR baselines, are summarised here and linked.
What Is a Baseline Survey?
A baseline survey measures the key conditions and indicators of a defined population before an intervention starts. It establishes the reference point, the starting line, against which all later change is assessed. In monitoring and evaluation (M&E) language, it supplies the baseline value for each indicator in the results framework or logframe.
Three features separate a baseline survey from an ordinary one-off survey:
- It is tied to an intervention. The indicators are chosen because a programme intends to change them, not because they are generally interesting.
- It is designed to be repeated. The questions, definitions, sample and season are fixed so that a midline or endline can measure the same things in the same way.
- It is timed before exposure. The data must describe the population before any programme activity could have influenced it.
Without a baseline you can describe what things look like at the end of a project, but you cannot credibly say the project caused any change. You also cannot set realistic targets, because you do not know where you are starting from.
Baseline Survey Meaning in Plain Terms
Put simply, the baseline survey meaning is "a snapshot of the starting position, taken carefully enough that you can take the same snapshot again later and compare". The word "baseline" comes from surveying and engineering, where a baseline is the fixed reference line from which other measurements are taken. In development, CSR and environmental work, the idea is the same: a fixed reference from which change is measured.
Baseline Study, Baseline Survey and Baseline Assessment
The terms are often used interchangeably, but there are useful distinctions.
| Term | Usual meaning | Typical methods |
|---|---|---|
| Baseline survey | A quantitative survey of households, beneficiaries, facilities or firms before an intervention | Structured questionnaire, probability sample, CAPI or paper |
| Baseline study | A broader exercise that may combine a survey with qualitative work, secondary data and context analysis | Survey plus focus groups, key informant interviews, document review |
| Baseline assessment | Often a lighter or rapid version used for planning or needs assessment | Rapid surveys, community mapping, secondary data |
| Environmental baseline (EIA) | Pre-project physical, biological and socio-economic conditions around a proposed site | Monitoring, field surveys, secondary data |
A baseline study is therefore usually the larger umbrella, and the baseline survey is its quantitative core. When donors or CSR teams ask for a "baseline study", check whether they expect qualitative components as well, because that changes the budget and timeline. For environmental work, the socio-economic part of an EIA baseline is covered in socio-economic surveys in EIA and the statistical side in EIA baseline data analysis.
Purpose of a Baseline Survey
Commissioners sometimes treat a baseline as a compliance cost. In practice it serves at least five purposes, and only one of them is impact measurement.
| Purpose | What the baseline provides | Who uses it |
|---|---|---|
| Measuring change | Starting values for every outcome indicator | Evaluators, funders, boards |
| Setting targets | Realistic targets based on actual starting levels | Programme managers |
| Targeting and design | Evidence on which problems are binding and who is most affected | Programme designers |
| Sampling frame | A household listing and tracking details for later rounds | Survey teams, monitoring staff |
| Accountability | A documented record of conditions before the project | Regulators, CSR committees, communities |
It targets the programme. A baseline routinely shows that the assumed problem is not the actual problem. A livelihoods programme designed around skills training may find that skills are adequate and market access is the binding constraint. Finding this before spending three years is worth far more than the survey cost.
It sets defensible targets. A target of "increase tap water access by 20 percentage points" means little if you do not know whether coverage starts at 10% or 75%. Baseline values turn vague goals into measurable ones.
It builds the sampling frame for everything that follows. The listing exercise behind a baseline produces a household roster that supports monitoring, endline tracking and beneficiary verification.
It establishes a relationship with the community. The first structured contact with a village sets expectations. A well-run baseline that explains the study and returns findings creates cooperation for later rounds; a rushed one creates suspicion that persists.
What a Baseline Survey Measures
The exact content depends on the project, but a baseline usually measures the indicators the programme intends to change, plus the context needed to interpret them.
| Indicator group | Examples | Common source in the questionnaire |
|---|---|---|
| Demographics | Household size, age, sex, caste or social group, education of head | Household roster |
| Income and livelihoods | Main occupation, income sources, days of work, migration | Livelihood module |
| Assets and housing | Housing type, land, livestock, durable goods | Asset module |
| Health and nutrition | Illness episodes, health spending, dietary diversity | Health module |
| Education | Enrolment, attendance, dropout, literacy | Education module |
| Water, sanitation, energy | Drinking water source, toilet access, cooking fuel, electricity hours | Amenities module |
| Knowledge, attitudes, practices (KAP) | Awareness of schemes, hygiene practices, farming practices | KAP module |
| Access to services | Bank accounts, government schemes, credit, insurance | Inclusion module |
| Project-specific outcomes | Whatever the logframe names, for example adoption of drip irrigation | Custom module |
A useful rule: every question should either produce an indicator in the results framework or be needed to interpret one (for example, disaggregating by sex or social group). Anything that fills no cell in your planned endline tables should be cut. For a full indicator list with definitions, see key socio-economic indicators every baseline should measure. Turning indicators into well-worded questions is a separate skill, covered in detail in how to design a baseline survey questionnaire.
Types of Baseline Survey
Baselines differ by unit of measurement and purpose. Many projects combine two or more types.
| Type | Unit surveyed | Typical use |
|---|---|---|
| Household baseline | Households and their members | Livelihoods, WASH, health, education programmes |
| Beneficiary baseline | Registered or eligible participants | Skilling, SHG, scholarship and enterprise programmes |
| Facility baseline | Schools, health centres, anganwadis | Infrastructure and service quality projects |
| Community baseline | Villages or wards, via key informants | Village-level infrastructure, governance |
| KAP baseline | Individuals | Behaviour change and awareness campaigns |
| Enterprise baseline | Farms, MSMEs, shops | Market linkage, credit and value chain projects |
| Socio-economic baseline for EIA or R&R | Households in the project influence area | Environmental clearance, resettlement planning |
The broader category these sit within, and how socio-economic surveys are used outside a baseline context, is explained in what is a socio-economic survey. Corporate social responsibility baselines have their own requirements around Schedule VII alignment and impact assessment, covered in baseline surveys for CSR and development projects.
When to Conduct a Baseline Survey
A baseline must be collected before the intervention touches the population. Not before the formal launch, but before any activity that could change what you are measuring.
This sounds obvious and is violated constantly, usually in one of four ways:
| What happens | Why the baseline is compromised |
|---|---|
| Awareness campaigns run first | Knowledge indicators have already shifted |
| Beneficiary lists drawn up before the survey | Selection has already occurred and respondents may answer strategically |
| Baseline run in the first month of activities | Early participants already differ from the population |
| "Retrospective baseline" reconstructed from recall | Recall is systematically biased towards the present |
The fourth deserves particular caution. Asking people to recall their income, expenditure or attitudes from two years ago produces figures anchored to their current state. A retrospective baseline tends to understate change where things improved and overstate it where they worsened. It is not evidence of impact.
Timing also has a seasonal dimension. Agricultural income, migration, water availability, illness and school attendance all vary across the year. A baseline in February and an endline in September will show differences that have nothing to do with the programme. Choose the fieldwork window deliberately and record it, because the endline must return to the same months.
Baseline Survey Steps: From Indicators to Report
The process below is the standard sequence for a quantitative household or beneficiary baseline. Each step has a dedicated guide on this site where the detail runs deeper.
- Agree the purpose and evaluation design. Decide whether the baseline is for description and targeting only, or for impact measurement. If impact is the aim, decide now whether there will be a comparison group, because it must be measured at baseline too. The design choices are explained in how baseline and endline surveys power impact evaluation.
- Define indicators. List each outcome indicator with a precise definition, unit, reference period and disaggregation. Draft the dummy tables for the endline report at this stage.
- Design the sample. Choose the sampling frame, the sampling method (simple random, stratified, cluster or multi-stage), and the sample size. Methods are compared in sampling methods for household surveys.
- Build and translate the questionnaire. Write questions that measure each indicator, translate into local languages, back-translate key items and program the form for CAPI if used.
- Pilot the instrument. Test it with respondents similar to the sample but outside it. Check length, skip logic, comprehension and sensitive questions, then revise.
- Recruit and train enumerators. Classroom sessions, mock interviews and field practice, with a written field manual covering definitions such as "household" and "head of household". See training enumerators for a quality field survey.
- Conduct the household listing. Where no reliable frame exists, list households in each selected village or ward and select the sample from the listing.
- Collect data with live quality control. Daily data review, back-checks, GPS and timestamps, and supervisor spot-checks. The protocols are covered in data quality control in large-scale surveys.
- Clean and analyse. Resolve duplicates, outliers and inconsistent skips, apply sampling weights, and calculate each indicator with its confidence interval. See how to clean survey data before analysis.
- Report and archive. Produce the baseline report, a cleaned dataset with codebook, the final questionnaire in every language, and tracking information for the endline.
Steps 2 and 3 are where most baseline problems begin. A vague indicator ("improved livelihoods") cannot be measured; an undersized sample cannot detect change later. Both are cheap to fix before fieldwork and impossible to fix afterwards.
Choosing a Data Collection Mode
Most household baselines in India are now collected with computer-assisted personal interviewing (CAPI) on phones or tablets, using ODK, KoboToolbox or SurveyCTO-class tools. These offer built-in skip logic and range checks, GPS capture, timestamps, audio audit options, multiple languages in one form and direct upload to a server for daily monitoring. Telephone interviewing (CATI) suits short follow-ups with known respondents, and paper still has a place in very low-connectivity settings or for very short instruments. The trade-offs are set out in CATI vs CAPI vs paper surveys.
Sample Size for a Baseline Survey
A baseline sized only to describe the population today will usually be too small to detect change tomorrow. If impact is the goal, the sample has to be set by the endline comparison, not the baseline description.
For Describing the Population
To estimate a proportion with a given margin of error, the standard formula is:
n = z² x p x (1 - p) / e²
where z is 1.96 for 95% confidence, p is the expected proportion and e is the margin of error. With p unknown, using 0.5 gives the largest (safest) sample. For p = 0.5 and e = 0.05, n is about 385 under simple random sampling.
For Detecting Change Between Two Groups
To detect a difference between two proportions (for example, a programme group and a comparison group at endline), a common approximation is:
n per group = (z for alpha + z for power)² x [p1(1 - p1) + p2(1 - p2)] / (p1 - p2)²
with z for alpha = 1.96 (two-sided, 5% significance) and z for power = 0.84 (80% power).
Design Effect and Attrition
Household surveys are almost always clustered: you select villages, then households within them. Households in the same village tend to be similar, so each extra household adds less information than an independent one would. The design effect captures this:
Design effect = 1 + (m - 1) x ICC
where m is the number of households per cluster and ICC is the intra-cluster correlation for the indicator. Finally, inflate for attrition, the households you will not find again at endline: divide by (1 - expected attrition rate).
Worked Example: Sizing a Baseline (Illustrative Numbers)
The following figures are illustrative, chosen to show the arithmetic, not taken from any real project.
A programme aims to raise the share of households using improved irrigation from an expected 40% to 50%, and will compare programme villages with comparison villages.
| Step | Calculation | Result |
|---|---|---|
| Base sample per group | (1.96 + 0.84)² x (0.40 x 0.60 + 0.50 x 0.50) / (0.10)² = 7.84 x 0.49 / 0.01 | about 385 households |
| Design effect | 15 households per village, ICC assumed 0.05: 1 + 14 x 0.05 | 1.70 |
| After design effect | 385 x 1.70 | about 655 households |
| After 10% attrition | 655 / 0.90 | about 728 households |
| Villages per group | 728 / 15 | 49 villages (rounded up) |
| Total baseline sample | 2 groups x 49 villages x 15 households | 1,470 households |
Two points follow. First, the sample is driven by the smallest change worth detecting: if success were defined as a 15 point improvement, the base sample would fall to roughly 170 per group. Second, the ICC assumption matters a great deal, so use values from similar surveys where possible and test the sensitivity. If the same households are tracked at baseline and endline, the correlation between rounds can reduce the required sample; a difference-in-differences power calculation accounts for this but needs an estimate of that correlation.
The full arithmetic, including unequal cluster sizes and multiple indicators, is worked through in how to determine sample size for a household survey, and the logic of power is explained in statistical power and effect size.
Baseline Survey Example: A Livelihoods Programme
This baseline survey example follows a hypothetical programme so that each step can be seen in context. All names, numbers and results are illustrative.
The programme. A three-year farm livelihoods programme in 49 villages of a rain-fed district plans to promote small-scale irrigation, link farmers to markets and strengthen women's self-help groups (SHGs). A further 49 similar villages in the same district form a comparison group.
Indicators. The results framework names five outcome indicators: annual household income, share of households using improved irrigation, share of cultivated land under a second crop, share of women who are active SHG members, and share of households with a bank account used in the last six months.
Design and sample. Villages were stratified by block and selected with probability proportional to size. In each village, a listing was carried out and 15 households selected by systematic random sampling, giving 1,470 households as in the sizing example above.
Fieldwork. The survey ran over five weeks in the post-kharif-harvest window, using CAPI forms in Hindi with a 45 to 55 minute median interview length. About 10% of interviews were back-checked by phone or revisit, and GPS points, the name of the household head, a phone number and a landmark were recorded for each household.
Illustrative baseline results:
| Indicator | Programme villages | Comparison villages | Target (programme, year 3) |
|---|---|---|---|
| Median annual household income (INR) | 96,000 | 98,500 | 20% real increase |
| Households using improved irrigation | 38% (95% CI 33 to 43) | 41% (95% CI 36 to 46) | 50% |
| Cultivated land under a second crop | 22% | 24% | 35% |
| Women active in an SHG | 31% | 29% | 50% |
| Households with an active bank account | 64% | 66% | 80% |
What the baseline revealed. The groups were broadly similar, which supports later comparison. But the survey also found that among households without irrigation, the most common reason given was lack of a reliable water source rather than lack of equipment. That finding led the programme to add farm ponds and check-dam repair before distributing pump sets, a design change that came from the baseline rather than the endline.
What it set up. The baseline produced the household roster for tracking, the exact questionnaire and definitions to reuse, and the season constraint that the endline must also run after the kharif harvest. The later comparison, using difference-in-differences, is explained in measuring impact with difference-in-differences.
Baseline Survey Report Format
A baseline report has two audiences: the programme team, who need findings they can act on now, and the future evaluator, who needs enough method detail to reproduce the survey exactly. The baseline survey report format below serves both.
| Section | Contents | Notes |
|---|---|---|
| 1. Executive summary | Purpose, design, sample, headline indicator values, key implications | Two to three pages; written last |
| 2. Programme background | Objectives, theory of change, results framework | Link each indicator to the framework |
| 3. Methodology | Evaluation design, sampling frame, sampling method, sample size calculation, design effect, weights | Enough detail for exact replication |
| 4. Instruments | Questionnaire modules, languages, pilot findings and changes | Full questionnaire goes in an annex |
| 5. Fieldwork | Dates, season, team size, training, quality control, response rates | Record non-response and replacements |
| 6. Respondent profile | Demographics of the achieved sample, comparison of groups | Shows balance between groups |
| 7. Indicator findings | One section per outcome area, with baseline values and confidence intervals | Disaggregate by sex, social group, location |
| 8. Programme implications | What the findings mean for targeting, design and targets | Where the baseline earns its cost |
| 9. Limitations | Coverage gaps, non-response, measurement issues | Be specific |
| 10. Endline guidance | What must be reproduced: wording, season, definitions, frame | Written for the future survey team |
| Annexes | Questionnaires, indicator definitions, dummy tables, codebook, tracking protocol | Archive with the cleaned dataset |
Two habits make a baseline report far more useful. First, report every indicator with its confidence interval and the number of observations behind it, so readers can see which differences are meaningful. Second, include the indicator definitions exactly as computed, including the denominator, because "share of households with tap water" can mean very different things depending on whether shared standposts count. Guidance on tables, charts and interval reporting is in how to present statistical results.
What Must Be Locked Down for Comparability
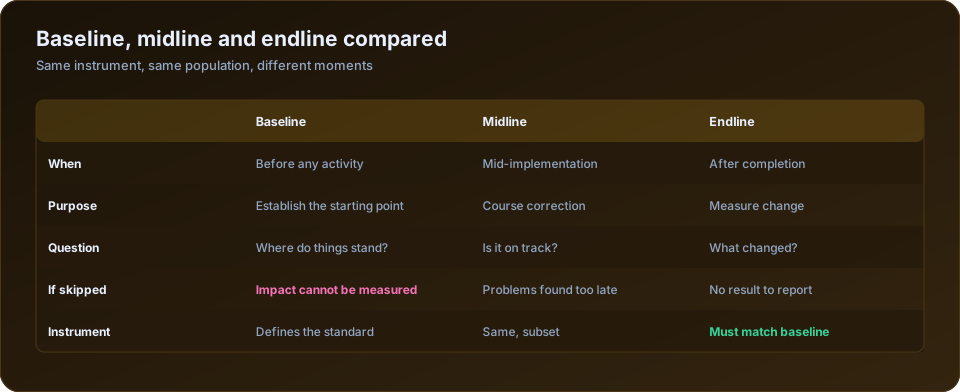
The baseline defines the standard the endline must match. Six things have to be recorded now and reproduced exactly later.
| Element | Why it must not change |
|---|---|
| Exact question wording | Changed wording changes the answer, not just the phrasing |
| Response options and their order | Adding a category redistributes responses across all of them |
| Reference periods | "Last 30 days" and "last month" collect differently |
| Season of fieldwork | Post-harvest and lean-season income are not comparable |
| Household definition | Joint families and migrants must be classified identically |
| Sampling frame and unit | The endline must reach the same population |
The season point is the most costly to get wrong and the least often planned for. Schedule the endline for the same months and write that constraint into the project plan at the start, when it is still free to arrange. How the endline then uses these fixed elements, how to handle attrition and whether to use a panel or fresh sample are covered in baseline vs endline survey, so they are not repeated here.
Common Baseline Survey Mistakes
| Mistake | Consequence | How to avoid it |
|---|---|---|
| Starting the baseline after activities begin | Starting values already contaminated | Fix the baseline date in the project plan before launch |
| Sizing the sample only for description | Endline cannot detect realistic change | Size for the minimum detectable effect, with design effect and attrition |
| Too many questions | Fatigue, falling data quality, longer fieldwork | Cut anything that fills no planned table |
| Vague indicator definitions | Baseline and endline compute different things | Write definitions with numerators and denominators |
| No comparison group | Change cannot be attributed to the programme | Decide the design before fieldwork |
| Missing tracking details | Households cannot be found at endline | Record GPS, names, phone and landmark |
| Untested translation | Respondents answer a different question | Back-translate key items and pilot in each language |
| Report omits method detail | Endline team cannot replicate | Include a methods section and endline guidance |
| Raw data not archived | Re-analysis impossible later | Archive raw and cleaned data, codebook and forms |
Many of these are forms of bias introduced in the field rather than at the design stage; practical safeguards are in how to reduce bias in field surveys.
A Baseline Checklist Before Fieldwork Starts
| Confirmed |
|---|
| The intervention has not begun in any sample area |
| Every indicator maps to a decision the programme will make |
| Indicator definitions written with numerator, denominator and reference period |
| Dummy tables for the endline report are drafted |
| Questionnaire piloted in each language it will be used in |
| Household definition written down and used in training |
| Sampling frame documented, with its date and source |
| Household identifiers recorded for endline tracking |
| Comparison group selected, if impact is to be measured |
| Sample sized for the effect you need to detect, plus design effect and attrition |
| Fieldwork season recorded and endline season agreed |
| Raw data, instruments and codebook will be archived for reuse |
The tracking row is easy to overlook and expensive to omit. Recording GPS coordinates, the head of household's name, a mobile number and a landmark description at baseline is what makes it possible to find the same household two years later. Without them, the endline becomes a fresh cross-section, and you lose the ability to analyse change at the household level.
If You Missed the Baseline Window
If a programme has already started, do not present a recall-based reconstruction as a baseline. The honest alternatives are an endline with a comparison group (adjusted by matching or regression), a regression discontinuity where eligibility followed a clear threshold, pre-programme administrative or census data for indicators whose definitions match, or a proper baseline in areas the programme has not yet reached. State the limitation plainly in every report that relies on it.
How DSTechnoverse Helps
DSTechnoverse designs and runs baseline surveys for CSR teams, NGOs, EIA consultants, project developers and researchers across India. Our socio-economic and baseline survey service covers indicator and sample design, questionnaire development and translation, CAPI programming on ODK, KoboToolbox or SurveyCTO-class tools, CATI or paper where suitable, enumerator training, field data collection with back-checks and daily monitoring, and a baseline report written with the endline already specified. For teams that have their own data, our statistical and research data analysis service handles cleaning, weighting and indicator estimation. Contact us to discuss your baseline.
Frequently Asked Questions
What is a baseline survey?
A baseline survey is a structured measurement of a target population's conditions taken before an intervention begins. It records the starting value of every indicator the programme intends to change, such as income, enrolment or water access, so that later midline or endline surveys have a fixed reference point for measuring change.
What is the difference between a baseline study and a baseline survey?
A baseline survey is the quantitative data collection, usually a structured questionnaire with a probability sample. A baseline study is often broader and may add focus groups, key informant interviews, secondary data and context analysis. In practice the terms overlap, so check whether a terms of reference expects qualitative components before budgeting.
When should a baseline survey be conducted?
Before any programme activity reaches the population, including awareness campaigns, beneficiary listing and pilot activities. Plan the timing so that fieldwork finishes before the first activity in any sample area, and record the season, because the endline must be conducted in the same months to avoid seasonal differences being mistaken for impact.
What should a baseline survey include?
Every outcome indicator in the programme's results framework, the demographic and contextual variables needed to interpret and disaggregate them, and household identifiers such as GPS, names and phone numbers for tracking. Anything that fills no cell in the planned endline tables should usually be cut to keep the interview short.
How large should a baseline sample be?
Large enough to detect the smallest change that would count as success at endline, not merely to describe the population today. Start from a two-group comparison formula, multiply by the design effect for clustering, and inflate for expected attrition. Illustratively, detecting a 10 point change from 40% may need over 700 households per group.
What is a baseline survey example?
A typical example is a household survey in programme and comparison villages before a livelihoods project, measuring income, irrigation use, second-crop area, SHG participation and banking. The baseline sets targets, checks the groups are similar and may reveal design issues, such as water availability, that change what the programme does first.
What is the format of a baseline survey report?
A common format covers an executive summary, programme background, methodology, instruments, fieldwork, respondent profile, indicator findings with confidence intervals, programme implications, limitations and guidance for the endline team. Annexes should hold questionnaires, indicator definitions, dummy tables, the codebook and the household tracking protocol.
Can a baseline survey be done retrospectively?
Not credibly. Asking people to recall conditions from years earlier produces answers anchored to their present situation, which biases estimated change. If the window was missed, use an endline comparison group, a regression discontinuity where eligibility followed a threshold, or matching secondary data, and state the limitation clearly.
How DSTechnoverse Runs Your Survey
DSTechnoverse is a full-service socio-economic and baseline survey agency based in Indore. We do not just advise — we run the whole study end to end and hand you evidence you can defend:
- Design — objectives, indicators, and sampling (random, stratified, cluster, or multi-stage), with a piloted questionnaire translated into local languages.
- Field data collection — trained enumerators using CAPI (tablet) tools such as KoBoToolbox, ODK, and SurveyCTO-style apps, with GPS stamping, audio audits, and built-in skip-logic validation.
- Quality control — back-checks, spot-checks, and daily high-frequency data monitoring so problems are caught in the field, not after.
- Analysis — SPSS, R, Python, and Excel for indicators, cross-tabulations, and impact estimates, including baseline–endline difference-in-differences.
- A detailed report — cleaned datasets, indicator tables, charts, GIS maps, and clear interpretation, with interactive Power BI / Tableau dashboards on request.
Our survey experience in Indore includes Smart City citizen-feedback surveys, Startup India & MSME surveys, Swachh Survekshan (Swachh Bharat) cleanliness surveys, and skill-development impact evaluations — delivered for government, municipal, corporate, and NGO clients.
Planning a socio-economic, baseline, endline, or willingness-to-pay survey? Talk to our survey team for a scope and quote.
Sources and Further Reading
Official and primary sources for the standards, rules and data discussed on this page.
- J-PAL Research Resources: practical guides to impact evaluation and survey design.
- World Bank DIME Wiki: field survey, data quality and impact evaluation guidance.
- Ministry of Statistics and Programme Implementation (MoSPI): official Indian surveys, sampling frames and NSS reports.
- UCLA Statistical Methods and Data Analytics: worked examples for SPSS, R, Stata and SAS.