
A socio-economic baseline is only useful if it measures the right things. Collect too little and you miss what matters; collect everything and you exhaust respondents and budget. Here are the core socio-economic indicators most baselines should consider.
Demographics
The foundation for everything else:
- Household size and composition
- Age and gender structure
- Marital status
- Migration status
Income and livelihoods
Often the central concern:
- Primary and secondary income sources
- Occupation and employment type
- Household income (or proxy measures where income is hard to capture)
- Seasonality and income stability
Expenditure and assets
Frequently more reliable than income:
- Household expenditure (food and non-food)
- Asset ownership — land, livestock, vehicles, durable goods
- Housing — type, materials, ownership
- Debt and savings
Education
- Literacy rates
- School enrolment and attendance
- Educational attainment by household member
Health and nutrition
- Access to healthcare facilities
- Nutrition and food security
- Prevalence of illness or specific conditions
- Maternal and child health indicators
Water, sanitation, and energy (WASH + energy)
- Source and reliability of drinking water
- Sanitation facilities
- Cooking fuel and electricity access
Infrastructure and services
- Access to roads and transport
- Connectivity (mobile, internet)
- Distance to key services and markets
Social and vulnerability factors
- Community/social group composition
- Vulnerable groups — female-headed households, elderly, disabled
- Social capital and participation
Project-specific outcome indicators
Beyond the standard set, add the specific indicators your programme intends to change — the outcomes you will re-measure at endline.
How to choose
Not every baseline needs every indicator. Select based on:
- Your objectives — what decisions the data must support
- Endline comparability — what you will need to re-measure
- Respondent burden — keep it as lean as credible
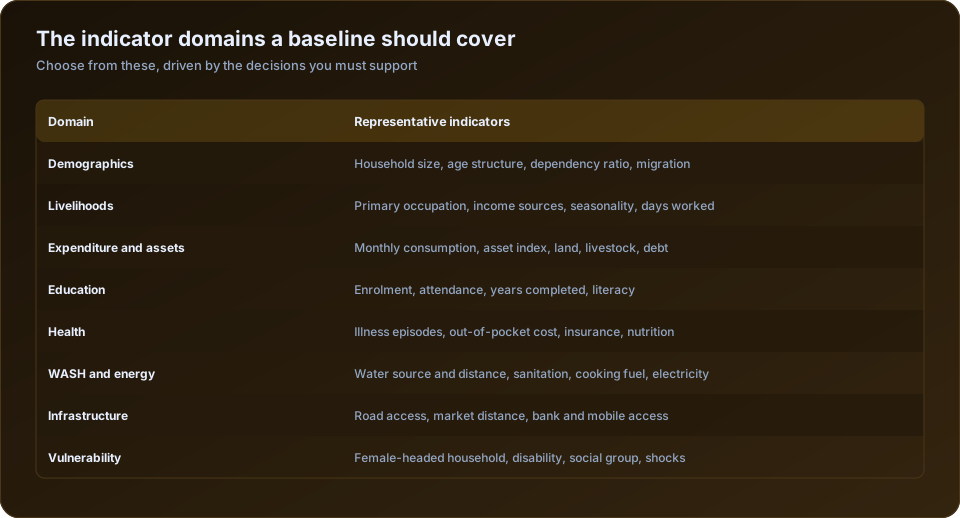
Defining an indicator so two analysts get the same number
An indicator is not a topic. "Income" is a topic; "median monthly household income from all sources, in INR, over the last 30 days" is an indicator. The test is whether two analysts, handed the same dataset, would produce identical figures.
Every indicator needs five things specified before the questionnaire is drafted:
| Component | Example |
|---|---|
| The measure | Net enrolment ratio |
| The unit | Children aged 6 to 14 |
| The reference period | Current academic year |
| The disaggregation required | By gender and social group |
| The source question | "Is [name] currently enrolled in school?" |
Skipping the reference period is the most frequent omission and the most damaging. "Household income" without a period is unanswerable — the respondent picks their own, and different respondents pick differently. "In the last 30 days" and "in a typical month" produce measurably different numbers from the same household.
Measuring economic status when income data is unreliable
Reported income is the weakest variable in most Indian household surveys. It is irregular, seasonal, drawn from several sources, frequently unknown to the person being interviewed, and understated for entirely rational reasons.
| Measure | Reliability | Interview burden |
|---|---|---|
| Reported monthly income | Low | Low |
| Income by source, itemised | Moderate | High — 15 minutes or more |
| Consumption expenditure, 30-day recall | Good | High |
| Consumption expenditure, 7-day for perishables | Better | High |
| Asset ownership index | Good for ranking | Low — 3 to 4 minutes |
| Housing quality index | Moderate | Very low |
| Food security scale | Good for the poorest | Low |
The asset index is the workhorse for good reason. A short list — pucca roof, electricity connection, LPG, refrigerator, two-wheeler, mobile phone, land, livestock — takes four minutes and ranks households reliably. It does not give you a rupee figure, but for identifying who is worse off, targeting a programme, or measuring change in relative position, it usually outperforms a reported income figure that took fifteen minutes to collect.
Use consumption expenditure when you need an absolute level, such as a poverty headcount. Use an asset index when you need a ranking or a change over time on a tight interview budget.
The indicator table, domain by domain
| Domain | Core indicators | Reference period |
|---|---|---|
| Demographics | Household size, age-sex distribution, dependency ratio, members migrated | Current; 12 months for migration |
| Livelihoods | Primary and secondary occupation, days of paid work, income sources | 30 days; 12 months for seasonality |
| Expenditure | Food and non-food consumption, health and education spend | 7 days perishables, 30 days other |
| Assets | Asset index, land owned and operated, livestock, debt outstanding | Current |
| Education | Enrolment, attendance, years completed, literacy, dropout reasons | Academic year |
| Health | Illness episodes, treatment sought, out-of-pocket cost, insurance | 30 days; 12 months for hospitalisation |
| Nutrition | Meal frequency, dietary diversity, food insecurity experience | 7 days; 30 days for insecurity |
| WASH | Water source, distance and time, toilet access and use, handwashing | Current |
| Energy | Cooking fuel, electricity connection, hours of supply | Current |
| Infrastructure | Distance to road, market, school, health facility, bank | Current |
| Financial inclusion | Account ownership, usage, borrowing source, insurance | 12 months |
| Vulnerability | Female-headed, disability, social group, shocks experienced | 12 months for shocks |
| Empowerment | Decision-making say, mobility, asset ownership by women | Current |
This is a menu, not a checklist. A typical baseline uses 20 to 30 indicators drawn from four or five of these domains — the ones connected to what the programme intends to change, plus the demographic and contextual variables needed to interpret them.
The selection test
Every proposed indicator should survive four questions:
Which decision does this inform? If nobody can name one, it comes out. This removes more questions than any other test.
Which table in the final report does it fill? Draft the report's dummy tables before writing the questionnaire, then confirm every question fills a cell.
Can it plausibly change in the programme period? Literacy among adults will not move in eighteen months. Enrolment might. Measuring indicators that cannot move produces a report showing no change and no information.
Is it already available for free? Census, NFHS, NSS and district statistical handbooks cover a great deal at district level. Collecting what already exists is spending field time to reproduce a published table.
Every extra question lengthens the interview, raises refusal and fatigue, and lowers data quality for everything else in the instrument. A 70-minute questionnaire cut to 40 minutes usually improves the quality of the surviving 40 minutes.
Aligning with national and international definitions
Where a standard definition exists, use it. The benefit is comparability: your findings can be set against district, state and national figures, which makes them far more interpretable.
| Indicator | Use the definition from |
|---|---|
| Improved water source and sanitation | WHO/UNICEF Joint Monitoring Programme |
| Multidimensional poverty | NITI Aayog National MPI |
| Food insecurity | FAO Food Insecurity Experience Scale |
| Dietary diversity | FAO household dietary diversity score |
| Employment and workforce participation | Periodic Labour Force Survey |
| Health indicators | National Family Health Survey |
| Asset index construction | Demographic and Health Survey wealth index method |
Adopting an established definition also means adopting a validated question wording, which saves the drafting and piloting effort described in how to design a baseline survey questionnaire.
Disaggregation, decided in advance
Deciding at analysis that you want block-level, gender-disaggregated figures is deciding too late — the sample had to be designed for it. Fix the disaggregation before sampling: which cuts will the report present, and does each have enough sample to support an estimate? This is worked through in how to determine sample size for a household survey.
For the wider study design see what is a baseline survey and how to conduct a socio-economic survey step by step. Our socio-economic and baseline survey service builds indicator frameworks mapped to reporting requirements. The NITI Aayog SDG India Index documents indicator definitions used across Indian government reporting.
The takeaway
A strong socio-economic baseline balances breadth and focus. Anchor it in your objectives, cover the core dimensions of well-being, and always include the outcome indicators you will track over time. Measured well, these indicators become the yardstick for everything the project later claims to achieve.
Frequently Asked Questions
What indicators should a socio-economic baseline measure?
Demographics, livelihoods, expenditure and assets, education, health, WASH and energy, infrastructure access, financial inclusion and vulnerability — selected down to the 20 to 30 that connect to what the programme intends to change, plus the context needed to interpret them.
How many indicators should a baseline survey have?
Twenty to thirty for most studies. Each additional indicator lengthens the interview and reduces data quality across the whole instrument. If an indicator does not fill a cell in a planned report table, it should not be in the questionnaire.
Why is asset ownership used instead of income?
Because reported income in rural India is irregular, seasonal, multi-source and commonly understated, while asset ownership is observable, quick to collect and stable. An asset index ranks households reliably in about four minutes of interview time.
What is the difference between an indicator and a question?
An indicator is the measure you report — median monthly consumption expenditure, net enrolment ratio. A question is what the enumerator asks. One indicator often needs several questions, and a question that feeds no indicator should be removed.
Should I use standard indicator definitions?
Yes wherever one exists. Using WHO/UNICEF JMP definitions for water and sanitation, or NFHS definitions for health, lets you compare your findings against district and national figures — which makes them far more interpretable to any reader.
How do I decide the reference period for an indicator?
Match it to how the behaviour occurs and how well people recall it: seven days for perishable food consumption, thirty days for regular expenditure and illness, twelve months for hospitalisation, migration and shocks. State the period in the question itself and keep it identical at endline.
How DSTechnoverse Runs Your Survey
DSTechnoverse is a full-service socio-economic and baseline survey agency based in Indore. We do not just advise — we run the whole study end to end and hand you evidence you can defend:
- Design — objectives, indicators, and sampling (random, stratified, cluster, or multi-stage), with a piloted questionnaire translated into local languages.
- Field data collection — trained enumerators using CAPI (tablet) tools such as KoBoToolbox, ODK, and SurveyCTO-style apps, with GPS stamping, audio audits, and built-in skip-logic validation.
- Quality control — back-checks, spot-checks, and daily high-frequency data monitoring so problems are caught in the field, not after.
- Analysis — SPSS, R, Python, and Excel for indicators, cross-tabulations, and impact estimates, including baseline–endline difference-in-differences.
- A detailed report — cleaned datasets, indicator tables, charts, GIS maps, and clear interpretation, with interactive Power BI / Tableau dashboards on request.
Our survey experience in Indore includes Smart City citizen-feedback surveys, Startup India & MSME surveys, Swachh Survekshan (Swachh Bharat) cleanliness surveys, and skill-development impact evaluations — delivered for government, municipal, corporate, and NGO clients.
Planning a socio-economic, baseline, endline, or willingness-to-pay survey? Talk to our survey team for a scope and quote.
Sources and Further Reading
Official and primary sources for the standards, rules and data discussed on this page.
- World Bank DIME Wiki: field survey, data quality and impact evaluation guidance.
- Ministry of Statistics and Programme Implementation (MoSPI): official Indian surveys, sampling frames and NSS reports.
- J-PAL Research Resources: practical guides to impact evaluation and survey design.
- ODK (Open Data Kit): open-source tools for CAPI mobile data collection.