
An Environmental Impact Assessment is not only about air, water, and ecology — it also has to reckon with people. Projects change livelihoods, displace households, and reshape communities. The socio-economic survey is how an EIA captures that human baseline.
Why EIAs need socio-economic data
The social chapter of an EIA (or the broader ESIA) must describe the communities a project will affect and predict how it will change their lives. That requires a solid socio-economic baseline covering:
- Demographics — population, household size, age and gender structure
- Livelihoods — occupations, income sources, dependence on local resources
- Land and assets — ownership, use, and any acquisition impacts
- Infrastructure and services — water, sanitation, health, education, transport
- Vulnerable groups — who is most at risk from project impacts
- Community perceptions — concerns, expectations, and attitudes
How the survey supports the assessment
Once the baseline is established, the assessment can:
- Predict impacts — who gains, who loses, and how significantly
- Identify affected people — especially for resettlement or land acquisition
- Design mitigation — livelihood restoration, compensation, community programmes
- Inform consultation — grounding stakeholder engagement in real data
- Enable monitoring — a baseline to track social outcomes over the project's life
Doing it well
Socio-economic surveys for EIA carry particular sensitivities:
- Representative sampling of the affected area and vulnerable groups
- Careful questionnaire design covering livelihoods, land, and perceptions
- Trained, local-language enumerators who can build trust
- Ethical practice — informed consent and sensitivity around land and income
- Rigorous documentation — the data must withstand regulatory and lender scrutiny
Linking to the wider EIA
The socio-economic survey does not sit alone. Its findings connect to resettlement planning, stakeholder consultation, and the impact-and-mitigation narrative that regulators and lenders (including those following international safeguard standards) expect.
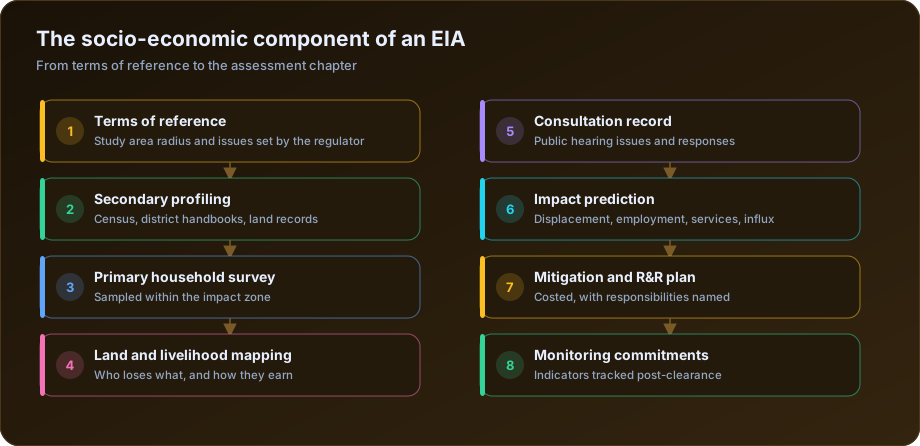
Where the study area comes from
Unlike a research survey, the geography of an EIA socio-economic study is not chosen by the analyst. It is set by the Terms of Reference issued by the appraisal committee, and getting it wrong is a common cause of the study being sent back.
| Zone | Typical definition | What is collected |
|---|---|---|
| Core zone | The project footprint itself | Complete enumeration of affected households |
| Buffer zone | Commonly 10 km from the boundary | Sampled household survey |
| Directly affected | Losing land, structures or livelihood access | Census, not sample — every household |
| Indirectly affected | Sharing roads, water, markets, labour | Sample, plus key informant interviews |
The directly affected group is enumerated completely, not sampled. Where compensation, resettlement or livelihood restoration will follow, a sample is useless — every affected household must be identified individually, because each will have an entitlement. Sampling this group is one of the errors most likely to draw an objection at the public hearing.
The 10 km radius is conventional rather than universal. Linear projects, projects with substantial water abstraction, and projects in dense settlements often carry different radii in the ToR. Read the ToR before designing anything.
What the assessment must actually predict
A socio-economic chapter that describes the population and stops has done half the work. The regulator is looking for prediction of impact and a costed response to it.
| Impact | What must be assessed |
|---|---|
| Land acquisition | Households losing land, area lost as a share of holding, remaining viability |
| Livelihood displacement | Who depends on the affected land, including tenants and landless labourers |
| Structure loss | Homes, shops, sheds, community assets, religious structures |
| Common property loss | Grazing land, ponds, fuelwood access, burial grounds |
| Labour influx | Incoming workforce size, pressure on housing, services, prices, social friction |
| Employment | Realistic local hiring by skill level, not aspirational totals |
| Service pressure | Schools, health facilities, water supply against incoming population |
| Traffic and access | Severance of routes, safety, journey times |
| Vulnerable groups | Scheduled Tribes, women-headed households, disabled, elderly |
Two of these are routinely under-assessed. Common property resources rarely appear in land records, so a study built only on revenue records will miss grazing land, ponds and fuelwood collection areas that landless households depend on most. Only fieldwork and community consultation surface them.
Labour influx is systematically underestimated. A construction workforce arriving in a small settlement affects rents, water availability, prices and social relations, and the effects fall hardest on the poorest residents. Assessment should cover peak workforce, accommodation arrangements, and the duration of the construction period.
The tenancy and landless problem
The most consequential data-quality issue in EIA socio-economic work is that land records identify owners, and impact falls on users.
| Group | Appears in land records | Loses from acquisition |
|---|---|---|
| Recorded landowner | Yes | Land, and compensation is due |
| Registered tenant | Sometimes | Livelihood, often uncompensated |
| Informal sharecropper | No | Entire livelihood |
| Agricultural labourer | No | Days of work, with no entitlement |
| Grazier using common land | No | Fodder access |
| Forest produce collector | No | Seasonal income |
A study built from revenue records alone will report that 47 households are affected when the true figure, counting those who work the land, may be several times higher. Household-level fieldwork with explicit questions about land use rather than land ownership is the only way to capture this, and its absence is a frequent and legitimate objection at public hearings.
Sample size, and why EIA baselines are smaller
An EIA socio-economic baseline is descriptive. It does not need to detect change over time, so the sample requirements are far lower than for an impact evaluation.
| Purpose | Typical sample |
|---|---|
| Directly affected households | 100% census |
| Buffer zone profile at ±6% | 400 to 450 households |
| Buffer zone with block-level disaggregation | 700 to 1,000 households |
| Key informant interviews | 15 to 30 across the study area |
| Focus group discussions | 6 to 12, disaggregated by gender and group |
The qualitative components are not decoration. Focus groups conducted separately with women and with affected occupational groups surface concerns that a structured questionnaire will not — and the public hearing will raise them whether or not the study did. It is better to have addressed them in the report.
Fitting the consultation requirement
The socio-economic study and the public consultation process are linked, and the study is stronger when it anticipates the hearing. Practical steps:
- Record concerns raised during fieldwork systematically, not anecdotally, so the report can show what people actually said.
- Disaggregate findings by the groups likely to speak at the hearing — displaced households, women, ST communities, landless labourers.
- State the response rate and who could not be reached. Gaps will be noticed.
- Make the affected-household enumeration verifiable, with identifiers, so individuals can check whether they were counted.
For the survey mechanics see how to conduct a socio-economic survey step by step and key socio-economic indicators every baseline should measure. Our socio-economic and baseline survey service delivers EIA socio-economic chapters, and our EIA data analysis outsourcing service covers the wider baseline workload. The MoEFCC PARIVESH portal carries the EIA Notification, standard Terms of Reference and cleared EIA reports worth reviewing as models.
The takeaway
In an EIA, the socio-economic survey gives the affected community a documented voice and a measurable starting point. Done rigorously, it produces a baseline strong enough to support impact prediction, mitigation design, and long-term monitoring — and credible enough to satisfy regulators and financiers.
Frequently Asked Questions
Why does an EIA need a socio-economic survey?
Because environmental clearance requires assessment of impacts on people, not only on air, water and ecology. The survey establishes who lives in the study area, how they earn, what they depend on, and what the project will change for them — and it underpins the resettlement and mitigation plan.
What area does an EIA socio-economic survey cover?
The study area is set by the Terms of Reference, commonly a 10 km buffer around the project boundary, with the directly affected zone enumerated completely rather than sampled. Linear projects and those with significant water abstraction often carry different radii.
How many households should be surveyed for an EIA?
Every directly affected household, as a census, plus a sample of the buffer zone — typically 400 to 450 households for a ±6% profile, or 700 to 1,000 where block-level breakdowns are required.
What is the difference between directly and indirectly affected households?
Directly affected households lose land, structures or direct access to a livelihood resource, and must be individually enumerated because entitlements attach to them. Indirectly affected households experience changes to shared services, traffic, prices or labour markets, and can be assessed through sampling.
Do landless and tenant households need to be surveyed?
Yes, and they are the group most often missed. Land records list owners, while sharecroppers, tenants, agricultural labourers and graziers may lose their entire livelihood without appearing anywhere in those records. Fieldwork must ask about land use, not just ownership.
What role does the survey play in the public hearing?
It supplies the factual basis for the discussion and, when done well, anticipates the concerns that will be raised. Studies that omit landless households, common property resources or labour influx impacts routinely attract objections at the hearing.
How DSTechnoverse Runs Your Survey
DSTechnoverse is a full-service socio-economic and baseline survey agency based in Indore. We do not just advise — we run the whole study end to end and hand you evidence you can defend:
- Design — objectives, indicators, and sampling (random, stratified, cluster, or multi-stage), with a piloted questionnaire translated into local languages.
- Field data collection — trained enumerators using CAPI (tablet) tools such as KoBoToolbox, ODK, and SurveyCTO-style apps, with GPS stamping, audio audits, and built-in skip-logic validation.
- Quality control — back-checks, spot-checks, and daily high-frequency data monitoring so problems are caught in the field, not after.
- Analysis — SPSS, R, Python, and Excel for indicators, cross-tabulations, and impact estimates, including baseline–endline difference-in-differences.
- A detailed report — cleaned datasets, indicator tables, charts, GIS maps, and clear interpretation, with interactive Power BI / Tableau dashboards on request.
Our survey experience in Indore includes Smart City citizen-feedback surveys, Startup India & MSME surveys, Swachh Survekshan (Swachh Bharat) cleanliness surveys, and skill-development impact evaluations — delivered for government, municipal, corporate, and NGO clients.
Planning a socio-economic, baseline, endline, or willingness-to-pay survey? Talk to our survey team for a scope and quote.