
A survey can be well-funded, large, and still wrong — if bias has crept in. Bias systematically pushes your results away from the truth, and it can enter at every stage. Knowing the main types is the first step to controlling them.
Sampling bias
When your sample does not represent the population.
- Cause: flawed sampling frame, convenience sampling, uneven selection
- Fix: use probability sampling, a complete frame, and proper randomisation
Non-response bias
When those who do not respond differ systematically from those who do.
- Cause: certain groups refuse, are absent, or are unreachable
- Fix: maximise response rates, follow up, plan replacement rules, and analyse who is missing
Question wording bias
When the way a question is phrased pushes respondents toward an answer.
- Cause: leading, loaded, or double-barrelled questions
- Fix: write neutral, single-idea questions; pilot them; avoid emotive language
Interviewer bias
When enumerators influence responses.
- Cause: tone, body language, prompting, or inconsistent administration
- Fix: train enumerators thoroughly, standardise administration, and monitor with back-checks
Social desirability bias
When respondents give answers that make them look good rather than the truth.
- Cause: sensitive topics (income, health, behaviour)
- Fix: ensure privacy and anonymity, word questions carefully, and consider indirect techniques
Recall bias
When respondents misremember past events.
- Cause: asking about things too far in the past
- Fix: use recent, specific reference periods ("in the last 7 days") and memory aids
Acquiescence bias
The tendency to agree regardless of content.
- Cause: all-positive question framing
- Fix: mix positively and negatively worded items and reverse-code as needed
Building bias control into the whole process
Reducing bias is not one fix — it is a mindset across the survey:
- Design — sound sampling and neutral questions
- Field — trained enumerators and privacy
- Monitoring — back-checks, response-rate tracking
- Analysis — check for and report potential biases
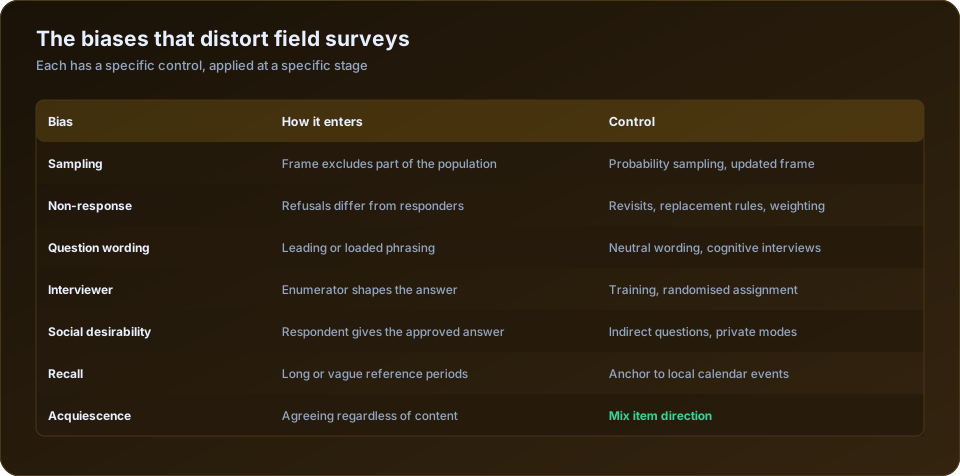
Which stage each bias enters, and where to block it
Bias is easier to prevent than to correct, and each type enters at a specific point. Placing the control at the wrong stage is why some surveys have elaborate quality systems and biased results.
| Bias | Enters at | Blocked at |
|---|---|---|
| Sampling bias | Frame construction | Design — probability sampling, updated frame |
| Non-response bias | Fieldwork | Field — revisits, timing, advance notice |
| Question wording bias | Instrument drafting | Design — cognitive interviews, piloting |
| Interviewer bias | Interview | Training and supervision |
| Social desirability | Interview | Design and mode — indirect questions, privacy |
| Recall bias | Interview | Design — shorter reference periods, anchoring |
| Acquiescence | Interview | Design — mixed item direction |
| Selection bias in analysis | Analysis | Analysis — weighting, attrition tests |
Note that four of the eight are blocked at the design stage, before anyone enters the field. Once a survey is fielded with a biased frame or a leading question, no amount of supervision recovers it. This is the argument for spending disproportionate time on design.
Non-response, the bias most surveys actually suffer from
A perfectly drawn sample with 62% response is not a probability sample of the population; it is a sample of people who agree to be interviewed, and those groups differ systematically.
| Who is under-represented | Consequence |
|---|---|
| Working adults, if interviews are 10am to 4pm | Employment and income understated |
| Households in gated or high-security housing | Wealthier end missing |
| Migrant and highly mobile households | Poverty and precarity understated |
| Households with no adult available | Small and single-earner households missed |
| People who distrust the sponsor | Systematic on attitude questions |
The controls, in order of effect:
Interview outside working hours. Evening and weekend slots are not a courtesy — they are the difference between reaching wage labourers and salaried workers or not. This single change usually moves the response rate more than everything else combined.
Fund three revisit attempts at different times of day. Budget for them explicitly, or enumerators will substitute households instead.
Notify the community in advance. A short conversation with the panchayat or ward representative before arrival reduces refusals substantially.
Pre-select replacement households. Drawn randomly in advance, so a substitution follows a rule rather than an enumerator's convenience.
Record every non-contact and refusal, with reason. This is what lets you report a response rate and test whether non-responders differ. A survey that reports only the interviews achieved cannot be assessed.
Social desirability, and the questions where it bites
Respondents give the answer they believe is approved. The effect is largest exactly where measurement matters most — programme participation, hygiene practice, child labour, alcohol, caste-related behaviour, women's autonomy.
| Technique | How it works | Best for |
|---|---|---|
| Indirect questioning | Ask what people in the village do, not what you do | Norms and stigmatised behaviour |
| Observation instead of report | Ask to see the toilet, the handwashing station | Assets and facilities |
| Self-administered module | Respondent enters the answer on the tablet privately | Sensitive individual behaviour |
| Randomised response | A randomising device shields any individual answer | Highly sensitive prevalence |
| List experiments | Respondent reports only a count of items | Attitudes people will not state |
| Matched interviewer | Women interviewing women on some topics | Reproductive health, autonomy |
| Genuine privacy | Conduct the interview away from other family members | Almost everything sensitive |
Privacy is the most under-used control and costs nothing. A woman answering questions about household decision-making while her husband stands beside her is not giving you her view. Enumerators should be trained to request privacy, and to record whether they achieved it so the analysis can check whether answers differ when others were present. That variable is one of the cheapest and most informative things you can add to an instrument.
Verification beats reporting where it is available. Asking to see the toilet gives a materially different figure from asking whether the household has one — and the gap between the two is itself a finding worth reporting.
Interviewer effects, and how to detect them
Different enumerators produce different data from the same population. Some of that is unavoidable; the part that is systematic is detectable.
| Control | Stage |
|---|---|
| Standardised wording, read as written | Training |
| Neutral probing drilled in role-play | Training |
| Random assignment of enumerators to areas | Design |
| Outcome distributions compared across enumerators | Daily monitoring |
| Audio audits on a sample of interviews | Fieldwork |
| Enumerator identifier retained in the dataset | Analysis |
Random assignment is what makes detection possible at all. If one enumerator worked exclusively in the poorest block, you cannot separate their effect from the population's characteristics. Rotate enumerators across areas and the comparison becomes meaningful.
Keeping the enumerator ID in the analysis dataset lets you test formally whether interviewer identity predicts your key outcomes after controlling for area. It should not. Where it does, you have found something that needs explaining before the results are reported. The monitoring mechanics are covered in data quality control in large-scale surveys.
Recall bias
People do not remember accurately, and the errors are directional rather than random. Recent events crowd out older ones, notable events are recalled more readily than routine ones, and respondents unconsciously shift remembered states toward their present situation.
| Control | Application |
|---|---|
| Shorter reference periods | 7 days for food, 30 for regular expenditure |
| Anchor to local calendar events | "Since Diwali", "since the last harvest" |
| Use a bounded recall design | Reference the previous survey visit |
| Ask about frequency, not totals | "How many days did you work?" not "total earnings" |
| Use records where they exist | Ration cards, school records, bills |
| Decompose large questions | Itemised expenditure rather than one total |
Anchoring to the local calendar is remarkably effective in rural fieldwork. "In the last six months" is abstract; "since Holi" is a date everyone shares.
For the design decisions that block most of these, see how to design a baseline survey questionnaire and sampling methods for household surveys; for the training that suppresses interviewer effects, training enumerators for a quality field survey. Our socio-economic and baseline survey service builds these controls into design and fieldwork. Pew Research's methods guidance covers question wording and non-response in accessible depth.
The takeaway
You will never eliminate bias entirely, but you can control it. Anticipate where it enters — sampling, wording, interviewers, responses — and design deliberately against each. Honest, representative data is worth the extra care.
Frequently Asked Questions
What is the most common bias in field surveys?
Non-response bias. A well-drawn sample with a low response rate is no longer representative, because those who refuse or are absent differ systematically from those interviewed — most often by employment status, mobility and wealth.
How can I reduce non-response in household surveys?
Interview in the evenings and at weekends, fund at least three revisit attempts at different times of day, notify the community in advance through local representatives, and pre-select replacement households randomly so substitution follows a rule rather than convenience.
What is social desirability bias?
The tendency to give the answer a respondent believes is approved rather than the accurate one. It affects reported hygiene, programme participation, child labour, alcohol use and women's autonomy most strongly. Privacy, indirect questioning and direct observation all reduce it.
How do you detect interviewer bias?
Assign enumerators randomly across areas, then compare outcome distributions, don't-know rates and interview durations across enumerators. Retain the enumerator identifier in the dataset so you can test whether it predicts key outcomes after controlling for location.
What is recall bias and how do you reduce it?
Systematic error in what respondents remember — recent and notable events crowd out routine ones, and remembered states drift toward the present. Reduce it with short reference periods, anchoring to local calendar events such as festivals or harvests, and using records where they exist.
Does the presence of other family members affect survey answers?
Substantially, particularly on questions about decision-making, autonomy, health and household finances. Train enumerators to request privacy, and record whether privacy was achieved as a variable so the analysis can test whether answers differ when others were present.
How DSTechnoverse Runs Your Survey
DSTechnoverse is a full-service socio-economic and baseline survey agency based in Indore. We do not just advise — we run the whole study end to end and hand you evidence you can defend:
- Design — objectives, indicators, and sampling (random, stratified, cluster, or multi-stage), with a piloted questionnaire translated into local languages.
- Field data collection — trained enumerators using CAPI (tablet) tools such as KoBoToolbox, ODK, and SurveyCTO-style apps, with GPS stamping, audio audits, and built-in skip-logic validation.
- Quality control — back-checks, spot-checks, and daily high-frequency data monitoring so problems are caught in the field, not after.
- Analysis — SPSS, R, Python, and Excel for indicators, cross-tabulations, and impact estimates, including baseline–endline difference-in-differences.
- A detailed report — cleaned datasets, indicator tables, charts, GIS maps, and clear interpretation, with interactive Power BI / Tableau dashboards on request.
Our survey experience in Indore includes Smart City citizen-feedback surveys, Startup India & MSME surveys, Swachh Survekshan (Swachh Bharat) cleanliness surveys, and skill-development impact evaluations — delivered for government, municipal, corporate, and NGO clients.
Planning a socio-economic, baseline, endline, or willingness-to-pay survey? Talk to our survey team for a scope and quote.
Sources and Further Reading
Official and primary sources for the standards, rules and data discussed on this page.
- World Bank DIME Wiki: field survey, data quality and impact evaluation guidance.
- Ministry of Statistics and Programme Implementation (MoSPI): official Indian surveys, sampling frames and NSS reports.
- UCLA Statistical Methods and Data Analytics: worked examples for SPSS, R, Stata and SAS.
- American Statistical Association: statement on p-values (2016): six principles for interpreting p-values correctly.