
You can run a perfect analysis and still lose your reader if the results are presented poorly. Clear reporting is what turns numbers into understanding — and it is a skill worth deliberately learning. Here is how to do it well.
Lead with the answer, not the machinery
Readers want to know what you found before how you found it. Start each result with the finding in plain language, then support it with the statistics:
"Customers who received follow-up calls were significantly more satisfied than those who did not (t(198) = 3.42, p = 0.001, d = 0.48)."
Report the full statistical detail
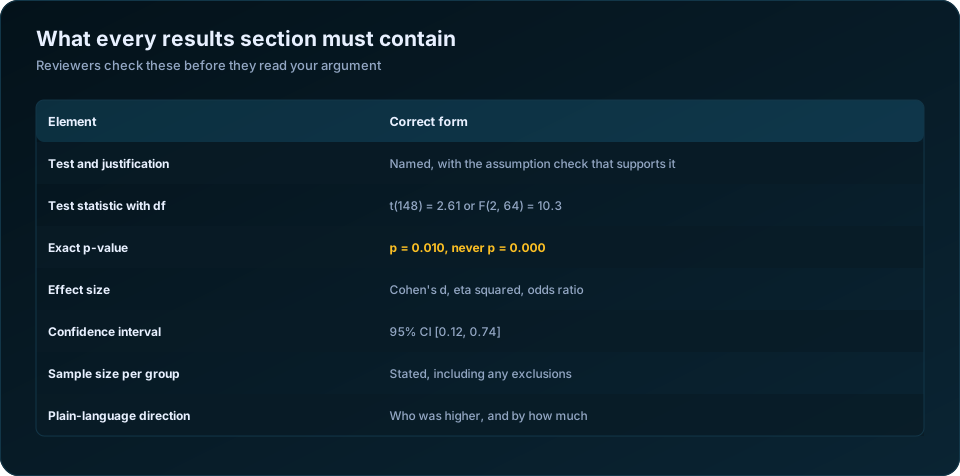
For each test, include:
- The test used
- The test statistic and degrees of freedom
- The exact p-value (p = 0.003, not just "significant")
- The effect size (Cohen's d, r, eta-squared, odds ratio)
This lets readers judge both significance and magnitude.
Use tables for detail, text for the story
- Tables carry the dense numbers — descriptive statistics, correlation matrices, regression coefficients.
- Text highlights the key findings and what they mean.
Never make the reader hunt through a table to find your main point.
Make charts that clarify, not decorate
- Choose the right chart: bar charts for group comparisons, scatter plots for relationships, line charts for trends over time
- Label axes, include units, and add a clear title
- Avoid 3-D effects and clutter that obscure the data
- Keep a consistent style across all figures
Follow the expected format
Academic work usually follows a style guide (APA is common). It standardises how you report means, p-values, and tables. Journals and universities expect it — match the convention your audience uses.
Common reporting mistakes
- Reporting p-values without effect sizes
- Tables with no context or explanation
- Charts that mislead (truncated axes, wrong chart type)
- Results in the text that do not match the tables
- Over-claiming — stating more than the data supports
Charts that clarify, and the ones that mislead
Chart choice is not decoration — the wrong chart can invert the reader's conclusion while every number in it is correct.
| Your data | Use | Avoid |
|---|---|---|
| Comparing values across categories | Horizontal bar chart, sorted by value | 3D bars, pie charts with 6+ slices |
| A trend over time | Line chart | Bar chart per year |
| Distribution of one variable | Histogram or boxplot | Mean with no spread |
| Relationship between two numerics | Scatterplot with a fitted line | Correlation coefficient alone |
| Agreement or Likert data | Diverging stacked bar | Mean of a single item |
| Parts of a whole, 2 to 4 parts | Stacked bar or pie | Pie with many small slices |
| Group means with uncertainty | Bar or dot plot with error bars | Bar with no error bars |
| Many groups compared | Dot plot | Cluttered grouped bars |
Three rules that eliminate most chart problems. Start bar chart axes at zero — truncating the axis exaggerates differences and is the most common way an honest analyst misleads a reader accidentally. Show uncertainty — a bar chart of group means with no error bars invites the reader to treat every visible gap as real. Sort by value, not alphabetically, unless the categories have a natural order; a sorted chart is read correctly in a second, an alphabetical one takes ten.
Pie charts deserve their poor reputation. Humans compare angles badly. Above four categories, a sorted horizontal bar chart conveys the same information more accurately in less space.
Structuring the results section
Reviewers read results sections in a predictable order, and writing to that order makes the work easier to assess.
| Order | Content |
|---|---|
| 1 | Sample profile: n, response rate, exclusions with reasons |
| 2 | Descriptive statistics for every key variable |
| 3 | Assumption checks and reliability, briefly |
| 4 | Primary research question, answered first |
| 5 | Secondary questions, in the order they were stated |
| 6 | Exploratory or unplanned analyses, labelled as such |
Answer the primary question first, before the secondary ones, regardless of which produced the more striking result. Reordering by how interesting the findings turned out to be is a subtle form of the outcome-switching that reviewers are trained to spot.
Label exploratory analyses explicitly. "We additionally examined, without prior hypothesis, whether..." costs one clause and protects the credibility of everything above it. Unlabelled post-hoc findings presented alongside pre-planned ones are the most common source of the multiplicity problems described in 10 common statistical mistakes in research.
Lead with the finding, not the machinery
The most common structural fault is a results section written as a narration of what the analyst did rather than what was found.
| Weak | Better |
|---|---|
| "An independent samples t-test was conducted. The result was significant (t = 2.61, p = 0.010)." | "Trained enumerators completed 4.2 more interviews per day than untrained ones (95% CI [1.0, 7.4]), t(148) = 2.61, p = 0.010, d = 0.43." |
| "Regression analysis was performed on the data." | "Education predicted income more strongly than any other factor: each additional year was associated with 1,240 rupees more per month, holding age, gender and district constant." |
| "The chi-square test yielded p = 0.03." | "Piped water access differed by district, ranging from 41% in Dhar to 68% in Indore, chi-square(3) = 8.9, p = 0.03." |
The pattern in every improved version: the finding in plain words and real units first, the statistical evidence after, in parentheses. The reader who skims gets the answer; the reader who scrutinises gets the evidence.
Tables that stand alone
A table should be readable without the surrounding text. That means:
- A title that states what is being shown, for whom, and with what n.
- Row and column labels in words, not variable names — "Monthly household income (INR)", not "hhinc_m".
- Consistent decimal places within each column, and no more than two for most statistics.
- Group sizes shown, so the reader can judge precision.
- A note defining every abbreviation and marking the significance convention.
- Horizontal rules only, no vertical gridlines, for APA style.
Split the labour deliberately: tables carry the detail, text carries the story. Do not repeat every number from a table in the prose. Pick the two or three that matter, interpret those, and let the table hold the rest.
Common reporting failures
| Failure | Why it is a problem |
|---|---|
| p = 0.000 | No p-value is zero; write p < .001 |
| Reporting only p, no effect size | The reader cannot judge whether it matters |
| Bar charts without error bars | Every visible gap looks real |
| Truncated y-axis on a bar chart | Visually exaggerates small differences |
| "Significant" used to mean "large" | Two different concepts, one word |
| Four decimal places on percentages | Implies precision the sample cannot support |
| Copying raw SPSS output into the document | Signals the results were not curated |
| Charts that need colour to be read | Fails in greyscale printing and for colour-blind readers |
| No n stated per group | Precision cannot be assessed |
The colour point is worth acting on. Roughly 8% of men have some form of colour vision deficiency. Use pattern, position or direct labelling in addition to colour, and check your figures in greyscale before submitting.
Matching the expected format
Different destinations expect different conventions, and matching them is cheap credibility.
APA (social sciences) wants italic statistical symbols, no leading zero on p and r values, two decimals for most statistics and three for p, and horizontal rules only. Journals in health and medicine usually follow ICMJE conventions and expect confidence intervals throughout. Programme and funder reports want the finding in plain language with the statistics in an annex.
For the numbers themselves see the p-value explained and regression analysis explained; for producing formatted output, SPSS data analysis for your thesis. Our statistical and research data analysis service delivers tables and figures formatted to the destination template. The APA Style guidance on statistics is the authoritative reference for the conventions above.
The takeaway
Presentation is not an afterthought — it is how your analysis earns its impact. Lead with the finding, report the full detail, use clean tables and honest charts, and follow your field's conventions. Do that, and your results will be as convincing as the work behind them.
Frequently Asked Questions
How should I report a p-value in a paper?
Give the exact value to three decimals, as p = .032, rather than a threshold statement. For very small values write p < .001. Never write p = .000, which is rounded output rather than a real value. In APA style, omit the leading zero.
What should always accompany a p-value?
The effect size and a confidence interval. Together they tell the reader how large the effect is and how precisely it was estimated, which the p-value alone cannot convey.
What is the best chart for comparing groups?
A sorted horizontal bar chart with error bars, or a dot plot when there are many groups. Start the axis at zero, sort by value, and always show uncertainty so the reader can judge which gaps are meaningful.
Should I put results in tables or in the text?
Both, with a division of labour. Tables carry the full detail and should be readable on their own. The text interprets the two or three numbers that matter most. Repeating an entire table in prose wastes space and buries the finding.
How many decimal places should I report?
Two for most statistics, three for p-values, and one for percentages in most survey work. More decimals imply a precision your sample size does not support and make tables harder to scan.
How do I present a non-significant result?
State it plainly and give the effect size and confidence interval anyway, along with the effect your study was powered to detect. "We found no evidence of a difference (p = .34); the study had 80% power to detect a difference of 6 points or more" is informative. "There was no difference" is not.
Need help turning your data into defensible results? DSTechnoverse offers statistical and research data analysis services in SPSS, R, and Python — survey analysis, thesis and dissertation support, and business statistics. Get in touch to discuss your dataset.