
You almost never survey everyone — you survey a sample and infer the rest. Which is why the sampling method is the quiet decision that determines whether your household survey represents reality or misleads you. Here are the core methods, in plain language.
Why sampling matters
A representative sample lets you generalise from a few hundred households to a whole population. A biased sample does the opposite — it produces confident, precise, wrong conclusions. The method you choose controls that risk.
Probability sampling (the gold standard)
In probability sampling, every household has a known, non-zero chance of selection. This is what lets you generalise with statistical confidence.
Simple random sampling
Every household has an equal chance of selection, like a lottery. Clean and unbiased — but it needs a complete list of all households (a sampling frame) and can scatter your teams inefficiently across a wide area.
Stratified sampling
Divide the population into strata (e.g. by region, income, urban/rural), then sample within each. This guarantees representation of every subgroup and improves precision — ideal when subgroups matter to your analysis.
Cluster sampling
Divide the population into clusters (e.g. villages or blocks), randomly select some clusters, then survey households within them. Far cheaper and more practical for fieldwork, at some cost to precision.
Multi-stage sampling
Combine the above in stages — for example, randomly select districts, then villages within them, then households within those. This is the workhorse method for large national and regional household surveys.
Non-probability sampling (use with caution)
Methods like convenience or quota sampling are quicker but do not support statistical generalisation, because selection probabilities are unknown. Fine for exploratory work; risky for anything that must represent a population.
Choosing a method
| Priority | Method to consider |
|---|---|
| Maximum simplicity, have full list | Simple random |
| Subgroups must be represented | Stratified |
| Field cost and logistics | Cluster |
| Large area, no full list | Multi-stage |
Do not forget non-response
Even a perfect design suffers if selected households refuse or are absent. Plan replacement rules in advance and track response rates — high non-response can quietly reintroduce the bias your sampling worked to avoid.
Choosing a method from what you actually have
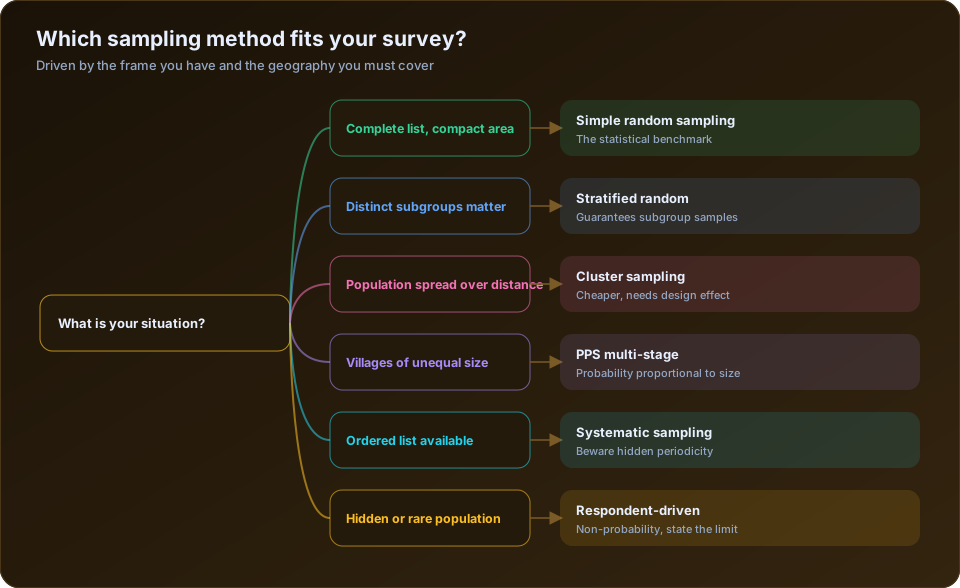
The textbook presents sampling methods as a menu. In practice the choice is made for you by two constraints: what list you can obtain, and how far apart the population lives.
| Your situation | Method | What it costs you |
|---|---|---|
| A complete, current list; population compact | Simple random | Nothing — this is the benchmark |
| Distinct subgroups you must report on separately | Stratified random | Slightly more design effort; usually improves precision |
| Population spread across many villages | Multi-stage cluster | A design effect of 1.5 to 2.5; cheaper fieldwork |
| Villages of very unequal size | PPS multi-stage | Complexity; but self-weighting if done right |
| An ordered list, no random number tool | Systematic | Risk if the list has hidden periodicity |
| No list exists at all | Listing exercise, then sample | Time and cost of the listing |
| Rare or hidden population | Respondent-driven or snowball | Loses probability status; state it plainly |
Stratification is under-used and almost free. If you must report separately for SC/ST households, or for three blocks, or for landless versus landowning, stratify on that variable and allocate sample to each stratum deliberately. Leaving it to chance means discovering at analysis that one group has 31 respondents and cannot support any statement.
The design effect, and why cluster samples need more people
Cluster sampling is the standard approach for rural household surveys because sending a team to 40 villages costs far less than reaching 1,000 scattered households. The price is statistical.
Households within a village share a water source, a school, a market, a road and often a caste composition. They resemble each other, so each additional household in the same village adds less new information than a fresh randomly chosen household would.
| Outcome being measured | Typical design effect | Interpretation |
|---|---|---|
| Piped water access | 3.0 to 5.0 | Almost determined at village level |
| Immunisation coverage | 2.0 to 3.0 | Strongly clustered by facility |
| School enrolment | 1.5 to 2.5 | Moderately clustered |
| Household income | 1.5 to 2.0 | Varies within villages |
| Individual attitudes | 1.2 to 1.6 | Least clustered |
A design effect of 2.0 means you need twice the sample of a simple random survey for the same precision. This is not optional accounting — it also has to be carried into the analysis, or every significance test in the report will be overstated. The practical rule for fieldwork: more villages with fewer households each beats fewer villages with many households each, for the same total sample.
PPS in practice, because it is where mistakes happen
Probability proportional to size is the standard multi-stage design, and it works like this. Villages are selected with probability proportional to their population, so a village of 900 is three times more likely to be selected than one of 300. Then a fixed number of households — typically 20 to 30 — is drawn in each selected village.
The result is elegant: every household in the district ends up with roughly the same overall probability of selection, so the sample is self-weighting and no weights are needed at analysis.
Three things break it:
Out-of-date population figures. PPS uses census or listing data that may be a decade old. A village that has doubled since is under-selected. Update the measure of size where you can.
Varying the households per cluster. Taking 30 in large villages and 15 in small ones destroys the self-weighting property and requires weights that are often then forgotten.
Replacing a whole village. Substituting an inaccessible village with a convenient one breaks the probability structure entirely. Select replacement villages in advance, using the same PPS procedure.
Weights: when you need them and what they do
| Weight type | Corrects for |
|---|---|
| Design weight | Unequal selection probabilities by design |
| Non-response adjustment | Groups that responded at lower rates |
| Post-stratification | Sample composition differing from known population totals |
Weights matter most when you deliberately over-sample a small group. If you took 300 SC/ST households from a population where they are 18%, unweighted district-level figures will be badly distorted. Weighted analysis restores the correct district picture while retaining the precision on the subgroup — the reason for over-sampling in the first place.
Weights must be carried into the analysis software properly. SPSS Complex Samples, the R survey package and Stata's svy commands all handle design and weights together. Applying weights while ignoring clustering fixes the point estimates and leaves the standard errors wrong.
Non-response is a sampling problem, not a data problem
A perfectly drawn sample with 60% response is not a probability sample of the population — it is a probability sample of people who agree to be interviewed, and those groups differ.
| Control | Effect |
|---|---|
| Three revisit attempts at different times of day | The largest single gain in response rate |
| Evening and weekend slots | Reaches working adults who are otherwise systematically missed |
| Advance notification through the panchayat | Reduces refusals materially |
| Pre-selected replacement households | Prevents enumerators choosing convenient substitutes |
| Recording every non-contact and refusal | Makes the response rate reportable and the bias assessable |
The last row is the discipline that most affects credibility. A survey that reports "1,000 households interviewed" tells you nothing. One that reports "1,180 selected, 1,000 interviewed, 84.7% response, non-responders concentrated in two peri-urban wards" is a study a reader can evaluate. See how to reduce bias in field surveys.
For sizing the sample once the method is chosen, see how to determine sample size for a household survey. Our socio-economic and baseline survey service documents the frame, method, design effect and weights in every report. The UN Handbook on Household Sample Surveys is the authoritative free reference on the designs described here.
The takeaway
Sampling is where representativeness is won or lost. Match the method to your population, resources, and analysis needs, handle non-response deliberately, and your few hundred interviews can speak credibly for thousands.
Frequently Asked Questions
What is the best sampling method for household surveys?
Multi-stage cluster sampling with probability proportional to size is the standard for rural household surveys, because it keeps fieldwork affordable across dispersed populations. Add stratification whenever you must report separately for defined subgroups.
What is a design effect and why does it matter?
It is the factor by which a clustered sample's variance exceeds that of a simple random sample of the same size. A design effect of 2.0 means you need double the sample for equivalent precision, and the analysis must account for clustering or every significance test will be overstated.
How do I sample when there is no list of households?
Conduct a listing exercise: enumerate every household in the selected villages or blocks first, then draw your sample from that list. It adds cost and time but is the only way to preserve probability sampling when no frame exists.
What is the difference between stratified and cluster sampling?
Stratification divides the population into groups and samples within every group, which improves precision. Clustering selects a subset of groups and samples within only those, which reduces cost but lowers precision. Most real surveys use both together.
Do I need survey weights?
Yes if selection probabilities differed — through over-sampling a subgroup, unequal cluster sizes, or non-response adjustment. A properly executed PPS design with a fixed number of households per cluster is self-weighting and needs none.
How many households should I take per village?
Twenty to thirty in most designs. Fewer villages with more households each raises the design effect and costs precision; more villages with fewer households each improves precision but raises travel cost. Twenty to thirty is where the two pressures usually balance.
How DSTechnoverse Runs Your Survey
DSTechnoverse is a full-service socio-economic and baseline survey agency based in Indore. We do not just advise — we run the whole study end to end and hand you evidence you can defend:
- Design — objectives, indicators, and sampling (random, stratified, cluster, or multi-stage), with a piloted questionnaire translated into local languages.
- Field data collection — trained enumerators using CAPI (tablet) tools such as KoBoToolbox, ODK, and SurveyCTO-style apps, with GPS stamping, audio audits, and built-in skip-logic validation.
- Quality control — back-checks, spot-checks, and daily high-frequency data monitoring so problems are caught in the field, not after.
- Analysis — SPSS, R, Python, and Excel for indicators, cross-tabulations, and impact estimates, including baseline–endline difference-in-differences.
- A detailed report — cleaned datasets, indicator tables, charts, GIS maps, and clear interpretation, with interactive Power BI / Tableau dashboards on request.
Our survey experience in Indore includes Smart City citizen-feedback surveys, Startup India & MSME surveys, Swachh Survekshan (Swachh Bharat) cleanliness surveys, and skill-development impact evaluations — delivered for government, municipal, corporate, and NGO clients.
Planning a socio-economic, baseline, endline, or willingness-to-pay survey? Talk to our survey team for a scope and quote.