
Analysts have a saying: garbage in, garbage out. No statistical test can rescue a dirty dataset. Before you analyse survey data, you have to clean it — and doing it properly is often the biggest part of the job.
Step 1: Get to know the dataset
Before changing anything, review it. How many responses? How many variables? What does each column mean? Keep a copy of the raw data untouched, and work on a copy.
Step 2: Handle incomplete and low-quality responses
- Partial responses — decide whether to keep, exclude, or analyse separately
- Speeders — respondents who finished implausibly fast may not have read the questions
- Straight-liners — people who chose the same option for every item
- Duplicate submissions — remove genuine duplicates
Document every rule you apply, so your decisions are transparent and defensible.
Step 3: Deal with missing values
Missing data is normal. Your options:
- Listwise deletion — drop cases with any missing value (simple, but loses data)
- Pairwise deletion — use available data test by test
- Imputation — estimate missing values (mean, regression, or multiple imputation)
The right choice depends on how much is missing and whether it is missing at random.
Step 4: Check for outliers
Outliers can be genuine extremes or data-entry errors. Use box plots or z-scores to spot them, then investigate before deciding whether to keep, correct, or exclude. Never delete an outlier just because it is inconvenient.
Step 5: Code and recode variables
- Assign numeric codes to categorical responses
- Reverse-code negatively worded items so scales run in the same direction
- Create derived variables (e.g. combining items into a scale score)
- Label everything clearly
Step 6: Validate and range-check
Confirm every variable falls within its valid range — no age of 200, no Likert answer of 9 on a 5-point scale. Catch impossible values now, not after analysis.
Step 7: Document what you did
Keep a cleaning log: what you changed, why, and how many cases it affected. This is what makes your analysis reproducible and reviewer-proof.
The payoff
Clean data is the foundation of trustworthy results. Spend the time here and every test you run afterwards means something. Skip it, and you are just computing precise answers to the wrong questions.
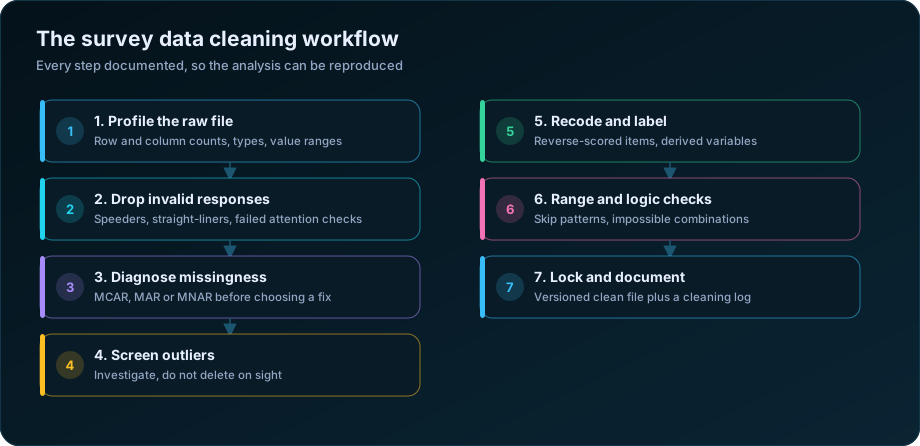
The rules that catch bad responses
Dropping a respondent is a serious act, so the criteria should be written down before you look at the data and applied mechanically. These are the checks that earn their place in almost every survey.
| Check | Rule of thumb | What it catches |
|---|---|---|
| Speeding | Completion under one third of the median time | Clicked through without reading |
| Straight-lining | Same answer for every item in a grid of 8+ | Disengaged respondent |
| Attention check failure | An item that instructs "select Agree" | Bots and inattentive panels |
| Impossible combinations | Age 19 with 25 years of work experience | Data entry or comprehension error |
| Duplicate submissions | Same device, same responses, minutes apart | Repeat entry, intentional or not |
| Excessive item non-response | More than 40% of key items blank | Partial completion |
| GPS outside the sample area | Coordinates outside the assigned village | Fabricated interview |
| Audio audit mismatch | Recording does not match the entered data | Enumerator fraud |
The last two apply specifically to CAPI field surveys and are among the strongest quality tools available. A GPS stamp and a short audio recording turn "we trust the enumerator" into something verifiable — see data quality control in large-scale surveys for how these fit into daily field monitoring.
State your exclusion criteria in the methods section, with counts. "We removed 47 of 1,240 responses: 22 for speeding, 14 for straight-lining, 11 for failed attention checks" is transparent. Silently ending up with 1,193 is not.
Missing data: diagnose the mechanism first
The percentage of missing values matters far less than why it is missing. Three mechanisms, with very different consequences:
MCAR — missing completely at random. A tablet crashed, a page was skipped by accident. The missingness is unrelated to anything. This is the benign case, and simple deletion is defensible.
MAR — missing at random. Missingness depends on something you observed. Older respondents skipped the online-banking question more often. You can model and impute it because the predictor is in your data.
MNAR — not missing at random. Missingness depends on the unobserved value itself. High earners refuse to state income. This is the dangerous case, and no imputation method fixes it without assumptions you cannot verify.
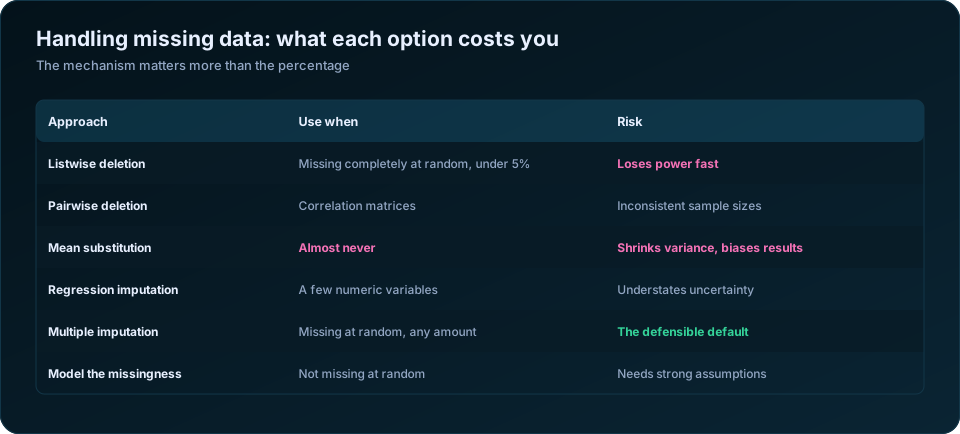
| Method | Use when | What it costs you |
|---|---|---|
| Listwise deletion | MCAR, under 5% missing | Power drops fast when many variables have gaps |
| Pairwise deletion | Correlation matrices only | Different n for every cell; matrices can misbehave |
| Mean substitution | Almost never | Artificially shrinks variance and biases correlations |
| Regression imputation | A few numeric variables, MAR | Understates uncertainty; makes data look too clean |
| Multiple imputation | MAR, any amount | Nothing much — this is the defensible default |
| Full information maximum likelihood | SEM and regression contexts | Built into the model; excellent when available |
Mean substitution deserves its bad reputation. It looks harmless, keeps your sample size intact, and quietly biases every variance and correlation in the dataset downward. Multiple imputation is available in SPSS, R (the mice package) and Stata, and takes an afternoon to learn.
Outliers: investigate, do not delete
An outlier is a data point that does not fit. That could mean an error, or it could mean the most interesting household in your sample.
| Detection method | Threshold | Best for |
|---|---|---|
| Z-score | Beyond ±3 | Roughly normal variables |
| IQR rule | Beyond 1.5 × IQR from the quartiles | Skewed variables — more robust |
| Boxplot inspection | Visual | Quick screening across many variables |
| Mahalanobis distance | Chi-square cutoff | Multivariate outliers |
| Cook's distance | Above 4/n | Influential cases in regression |
The decision tree is short. Is it impossible (age 250)? Correct it or set it to missing. Is it possible but extreme (a household earning forty times the median)? Keep it, and consider a transformation, a robust method, or reporting the analysis with and without it. Deleting values because they are inconvenient is a form of data manipulation, however well intentioned.
For income, land holding, expenditure and similar right-skewed variables that dominate Indian household survey work, a log transformation usually solves the problem better than any deletion rule.
Recoding, and the item everyone gets wrong
| Task | Why it matters |
|---|---|
| Reverse-score negative items | Otherwise reliability collapses and scale means are meaningless |
| Collapse rare categories | Chi-square needs expected counts of 5 or more |
| Create derived variables | Per-capita income, dependency ratio, asset index |
| Standardise date and unit formats | Mixed dd/mm and mm/dd corrupts any time analysis |
| Set explicit missing codes | 99 and 999 must be declared missing, not analysed as values |
| Label everything | So the output is readable a year later |
The last two cause the most damage. A "don't know" coded as 99 and left undeclared will silently inflate every mean in your dataset. Always check the minimum and maximum of every variable after import — that single habit catches the majority of coding disasters. Reverse-scored items are the other classic: a five-item satisfaction scale with two negatively worded items will show a Cronbach's alpha near zero until they are reversed, which is a useful diagnostic in itself. See reliability and validity in survey research for what to do next.
The cleaning log, and why it is not optional
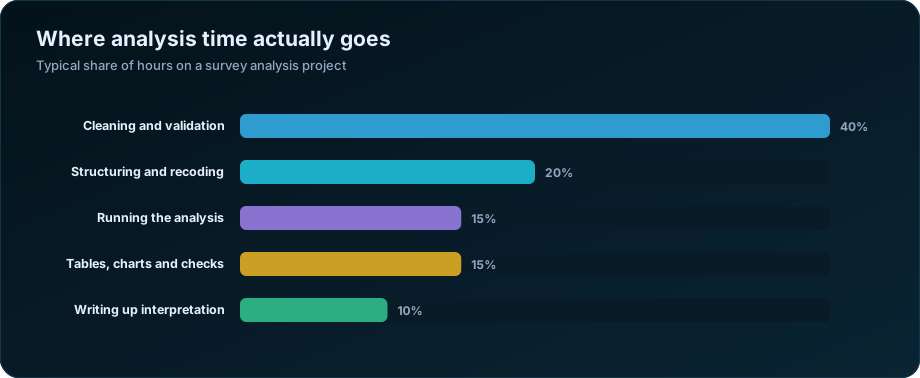
Cleaning routinely consumes 40% of the hours on a survey project — more than the analysis itself. The output of that work should be three artefacts, not one:
- The raw file, never modified. Read-only, archived, exactly as it came from the field.
- The cleaning script or syntax, which turns the raw file into the clean one.
- The clean file, versioned and dated, which is the only one the analysis touches.
Anyone should be able to delete the clean file and rebuild it by running the script. If they cannot, you do not have a reproducible analysis — you have a spreadsheet with an untraceable history. This is the same discipline that makes an SPSS thesis analysis survive a viva, and it is why saving syntax matters more than which software you chose. Our statistical and research data analysis service delivers all three artefacts as standard. The World Bank's Development Impact Handbook sets out the same discipline for large field studies.
Frequently Asked Questions
How much missing data is acceptable?
There is no fixed threshold. Under 5% missing completely at random is generally unproblematic. Above 10% you should use multiple imputation rather than deletion, and report the pattern. What matters most is the mechanism, not the percentage — 3% missing because high earners refused is worse than 15% missing because a tablet crashed.
Should I delete outliers from my survey data?
Only if they are impossible or demonstrably erroneous. Extreme but plausible values usually carry real information. Consider a transformation or a robust method instead, and if you do exclude cases, report the analysis both with and without them.
What is the difference between data cleaning and data screening?
Cleaning fixes errors — wrong codes, impossible values, duplicates. Screening checks whether the cleaned data meet the assumptions of your planned analysis, such as normality and multicollinearity. Cleaning comes first; screening decides which test you can run.
How long does survey data cleaning take?
Typically 30 to 50% of total analysis hours. For a 1,000-household survey with 80 questions, budget one to two weeks. Paper-based surveys with manual entry take longer because they need double entry and reconciliation.
Can I clean survey data in Excel?
For small, simple datasets, yes. For anything larger it becomes risky, because Excel edits leave no record of what was changed. Use SPSS syntax, R or Stata so every change is scripted and reproducible.
What is straight-lining in survey responses?
When a respondent selects the same option for every item in a grid — all fives, or all threes down the column. It signals disengagement rather than genuine agreement. Flag it when it occurs across a block of eight or more items, particularly if some are reverse-worded.
Need help turning your data into defensible results? DSTechnoverse offers statistical and research data analysis services in SPSS, R, and Python — survey analysis, thesis and dissertation support, and business statistics. Get in touch to discuss your dataset.