
Suppose incomes rose in the villages where you ran a livelihood programme. Great — but incomes may have risen everywhere that year. So how much of the increase did your programme cause? Difference-in-differences (DiD) is an elegant answer, and it runs directly on baseline and endline data.
The problem DiD solves
A simple before-vs-after comparison is tempting but flawed. If the treatment group's income rose, you cannot tell how much came from the programme and how much from broader trends (a good harvest, economic growth, another scheme). You need to separate the two.
The core idea
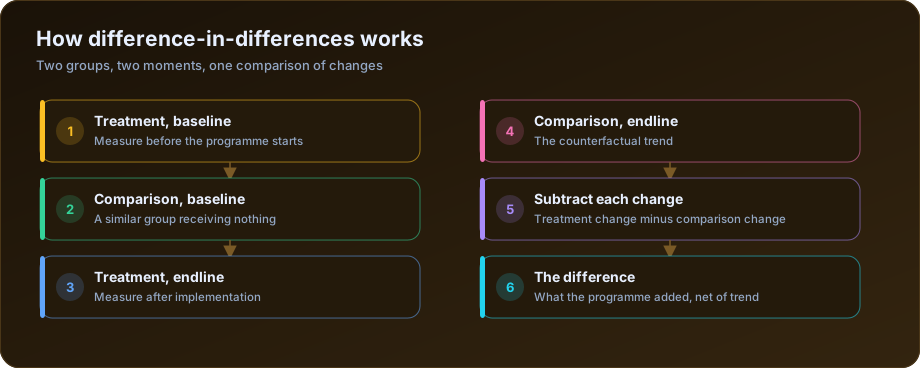
DiD compares the change in a treatment group to the change in a comparison group over the same period.
- Treatment group — receives the programme
- Comparison group — similar, but does not
Both are surveyed at baseline and endline. Then:
DiD impact = (Treatment endline − Treatment baseline) − (Comparison endline − Comparison baseline)
The comparison group's change captures the trends that would have affected the treatment group anyway. Subtracting it strips those out, leaving the programme's true effect.
A simple example
Say monthly income (in ₹):
- Treatment: baseline 5,000 → endline 6,000 (change +1,000)
- Comparison: baseline 5,000 → endline 5,400 (change +400)
Before-vs-after alone would credit the programme with +1,000. But the comparison group rose +400 without it. So the DiD estimate of impact is 1,000 − 400 = +600 — the change attributable to the programme.
The key assumption: parallel trends
DiD relies on the parallel trends assumption: without the programme, the two groups would have changed by the same amount. You cannot prove it, but you can support it by:
- Choosing a comparison group similar to the treatment group at baseline
- Where possible, showing the groups moved together before the intervention
Why baseline and endline are essential
DiD needs two time points for two groups — four measurements. Miss the baseline for either group and the method cannot be applied. This is yet another reason a rigorous baseline, including a comparison group, is worth the upfront effort.
Strengths and limits
- Strengths: intuitive, controls for shared trends, works with standard survey data
- Limits: depends on the parallel-trends assumption and a genuinely comparable control group
The arithmetic, worked twice
DiD is four numbers and two subtractions. Working through a case where the naive answer misleads makes the logic stick.
A skills programme runs in 20 treatment villages, with 20 comparison villages. The outcome is the share of households with a household member in regular paid work.
| Baseline | Endline | Change | |
|---|---|---|---|
| Treatment villages | 34% | 47% | +13 points |
| Comparison villages | 31% | 38% | +7 points |
| Difference-in-differences | +6 points |
Three answers are available from this table, and two of them are wrong.
The before-after answer: +13 points. This attributes the entire rise to the programme, ignoring that comparison villages rose 7 points with no programme at all. It overstates impact by more than double.
The endline-comparison answer: +9 points. Comparing 47% against 38% at endline ignores that treatment villages already started 3 points higher. It overstates impact by half.
The DiD answer: +6 points. The treatment group gained 13; without the programme it would plausibly have gained 7, like the comparison group; the programme added the remaining 6.
Now the case that matters. Suppose the comparison villages had fallen to 26%, a change of −5 points during a drought year. DiD gives 13 − (−5) = +18 points. The programme did far more than the raw 13-point rise suggests: it delivered gains while the surrounding area was losing ground. A before-after comparison would have understated the programme badly. This is why DiD is worth the extra survey cost — it corrects in both directions.
Parallel trends: the assumption everything rests on
DiD assumes that without the programme, treatment and comparison groups would have moved in parallel. Not that they were at the same level — the design explicitly allows different starting points — but that they would have changed by the same amount.
This assumption cannot be tested directly, because the counterfactual is unobservable. It can be made more or less plausible:
| Evidence | What it shows |
|---|---|
| Multiple pre-programme periods moving in parallel | The strongest available support |
| Similar baseline characteristics across many variables | Groups are broadly comparable |
| Similar geography, economy and administration | Common shocks affect both |
| Placebo test on an unaffected outcome | No spurious effect where none should exist |
| No differential shock in the period | Nothing else hit one group only |
If you have three or more pre-programme observations, plot them. Two lines that tracked each other for years before diverging exactly when the programme started is the most persuasive evidence an evaluation can offer.
The assumption fails most often in a specific way: treatment areas were selected because they were changing — deteriorating fastest, or showing most potential. Programme placement is rarely random, and where selection was driven by trajectory rather than level, parallel trends is exactly what does not hold.
The regression form, and why you should use it
The four-cell table gives the estimate. Running DiD as a regression gives you standard errors, controls and the ability to handle unbalanced data.
The model has three terms: an indicator for being in the treatment group, an indicator for the endline period, and the interaction of the two. The coefficient on the interaction term is the DiD estimate. Everything else is scaffolding.
Two practical requirements:
Cluster the standard errors at the level of treatment assignment — usually the village. If the programme was assigned to villages, households within a village are not independent observations, and unclustered standard errors will be far too small. This single omission is the most common technical error in applied DiD work.
Add baseline covariates. They do not change the estimate much if randomisation or matching worked, but they improve precision and demonstrate robustness.
For panel data where the same households appear twice, household fixed effects absorb every time-invariant household characteristic, which is a substantial gain in power over a repeated cross-section.
When DiD is the wrong tool
| Situation | Problem | Better approach |
|---|---|---|
| Programme placed where trends were already diverging | Parallel trends fails at the root | Regression discontinuity, or IV |
| Comparison group also received a similar programme | Contamination | Find an uncontaminated comparison |
| Villages phased in at different times | Standard two-way fixed effects is biased | Staggered-adoption DiD estimators |
| Only one treated unit | No meaningful standard error | Synthetic control |
| Outcome measured on different instruments | The change is partly measurement | Fix comparability first |
| Effect emerges slowly, endline is early | Underestimates true impact | Extend the follow-up period |
The staggered rollout case has received considerable attention in the recent econometrics literature. When units are treated at different times, the conventional two-way fixed effects estimator can produce a biased estimate — in some configurations, even the wrong sign. If your programme rolled out in waves, use one of the newer estimators designed for it rather than the standard specification.
What to report
A DiD result should always be presented with: the four-cell table so readers can see the raw numbers; the estimate with a confidence interval; clustered standard errors, with the clustering level named; a baseline balance table; pre-trend evidence if available; and attrition by arm.
The four-cell table matters more than it appears. It lets any reader reconstruct your estimate in their head, which builds confidence in a way a regression coefficient alone does not.
For the surrounding design choices see how baseline and endline surveys power impact evaluation; for keeping the two rounds comparable, baseline vs endline survey. Our socio-economic and baseline survey service runs both rounds and the estimation. J-PAL's methods resources cover DiD specification and the staggered-adoption problem in accessible detail.
The takeaway
Difference-in-differences turns baseline and endline surveys into a credible impact estimate by asking not "did things change?" but "did they change more than they would have anyway?" With comparable groups and four well-collected measurements, it is one of the most practical tools in evaluation.
Frequently Asked Questions
What is difference-in-differences?
A method that estimates programme impact by comparing the change over time in a treated group against the change over the same period in an untreated comparison group. Subtracting the second change from the first removes both pre-existing group differences and any common trend.
What is the parallel trends assumption?
The assumption that, absent the programme, the treatment and comparison groups would have changed by the same amount. It permits different starting levels but not different trajectories. It cannot be tested directly, only supported with pre-programme trend data and balance evidence.
Can difference-in-differences be used without randomisation?
Yes — that is its main purpose. It is designed for situations where a programme was placed non-randomly, provided a credible comparison group exists and parallel trends is plausible. It does not fix comparison groups selected because they were on a different trajectory.
What data do I need for a DiD analysis?
Outcome measurements for both a treatment and a comparison group, at both baseline and endline, using the same instrument and definitions. Baseline covariates improve precision, and multiple pre-programme periods allow you to test the parallel trends assumption.
Do I need to survey the same households at baseline and endline?
Not strictly — DiD works with repeated cross-sections from the same populations. Tracking the same households gives more statistical power through fixed effects, at the cost of managing attrition. Either is valid if the sampling is consistent across rounds.
What is the most common mistake in DiD analysis?
Failing to cluster standard errors at the level treatment was assigned. If the programme was assigned by village, households within villages are not independent, and unclustered errors make results look far more significant than they are.
How DSTechnoverse Runs Your Survey
DSTechnoverse is a full-service socio-economic and baseline survey agency based in Indore. We do not just advise — we run the whole study end to end and hand you evidence you can defend:
- Design — objectives, indicators, and sampling (random, stratified, cluster, or multi-stage), with a piloted questionnaire translated into local languages.
- Field data collection — trained enumerators using CAPI (tablet) tools such as KoBoToolbox, ODK, and SurveyCTO-style apps, with GPS stamping, audio audits, and built-in skip-logic validation.
- Quality control — back-checks, spot-checks, and daily high-frequency data monitoring so problems are caught in the field, not after.
- Analysis — SPSS, R, Python, and Excel for indicators, cross-tabulations, and impact estimates, including baseline–endline difference-in-differences.
- A detailed report — cleaned datasets, indicator tables, charts, GIS maps, and clear interpretation, with interactive Power BI / Tableau dashboards on request.
Our survey experience in Indore includes Smart City citizen-feedback surveys, Startup India & MSME surveys, Swachh Survekshan (Swachh Bharat) cleanliness surveys, and skill-development impact evaluations — delivered for government, municipal, corporate, and NGO clients.
Planning a socio-economic, baseline, endline, or willingness-to-pay survey? Talk to our survey team for a scope and quote.