
Quick answer: A socio-economic survey is a structured study of the social and economic conditions of a group of people, usually households in a defined area. It collects data on who lives there, how they earn and spend, their education, health, housing, access to water, sanitation, energy and services, and how vulnerable they are. The results describe the population and give a baseline against which a project, programme or policy can be planned and its impact measured.
Before a development programme, an industrial project, or a policy can be judged a success, someone has to answer a basic question: what were people's lives actually like to begin with? A socio-economic survey answers exactly that — and it is the foundation of credible planning, impact measurement, and compliance.
Socio-Economic Survey Meaning
The term has two parts. Social covers people and communities: household composition, age and gender, education, health, social group, migration, and access to services. Economic covers livelihoods and wealth: occupation, income sources, expenditure, assets, land, livestock and debt. A socio-economic survey measures both together, because they explain each other. A household's income depends on education and health; its health depends on income, water and sanitation.
In practice, "socio-economic survey" means the method (a sampled household questionnaire, often with community interviews and secondary data) and the output (a dataset and a report profiling the population). In Hindi it is commonly called a सामाजिक-आर्थिक सर्वेक्षण (samajik-arthik sarvekshan).
Types of Socio-Economic Surveys
| Type | Purpose | Typical design |
|---|---|---|
| Baseline survey | Record conditions before a project or programme starts | Sampled households, repeated later as an endline |
| Endline or impact survey | Measure change after the intervention | Same indicators and sample design as the baseline |
| Socio-economic profile for EIA | Describe the population in a project's study area | Secondary data plus a primary household sample and consultations |
| Social impact assessment (SIA) | Identify who is affected by land acquisition or a project and how | Census of affected households, consultations, impact analysis |
| Census or enumeration of affected people | Count and record every affected household | Complete coverage of a small population |
| Livelihood or market survey | Understand income, skills, demand or willingness to pay | Targeted sample, often shorter questionnaire |
| Rapid or panel monitoring survey | Track a few indicators frequently | Short questionnaires, often by phone |
The choice of type decides the sample, the questionnaire and the report. A baseline that will later be compared with an endline needs a sample design and indicator definitions that can be repeated exactly.
Well-Known Socio-Economic Surveys in India
Large national surveys are useful both as examples and as benchmarks for a project-level study:
- Socio Economic and Caste Census (SECC) 2011 — a household-level enumeration used to identify deprived households for welfare schemes.
- National Family Health Survey (NFHS) — health, nutrition, family welfare and household amenities, with district-level estimates.
- National Sample Survey (NSS) rounds — consumption expenditure, employment, health, education and other themes, run by the Ministry of Statistics and Programme Implementation.
- Periodic Labour Force Survey (PLFS) — employment and unemployment, with quarterly urban estimates.
- Census of India — population, housing and amenities for every village and town.
A project survey rarely needs to replicate these. It uses them for context and comparison, and collects primary data on what they do not cover: the specific villages, households and issues the project affects.
Measuring Socio-Economic Status: The Kuppuswamy and Prasad Scales
Many Indian studies, especially in health research, classify households by socio-economic status (SES) using a standard scale.
The Modified Kuppuswamy Scale scores three items for the head of the household and the family:
| Component | Score range |
|---|---|
| Education of the head of household | 1 to 7 |
| Occupation of the head of household | 1 to 10 |
| Total monthly family income | 1 to 12 |
The total score places the family in one of five classes: Upper (26 to 29), Upper middle (16 to 25), Lower middle (11 to 15), Upper lower (5 to 10) and Lower (below 5). The income brackets are revised periodically using the Consumer Price Index for Industrial Workers, so always use the latest updated version.
The Modified B.G. Prasad Scale classifies families by per capita monthly income into five classes, also updated with the consumer price index, and is used more often for rural populations.
For project baselines, an asset index built from the survey itself (housing material, durable goods, land, livestock) is often more robust than a fixed scale, because it does not depend on reported income.
Example Socio-Economic Survey Questions
A typical household questionnaire covers modules like these:
| Module | Example questions |
|---|---|
| Household roster | How many people usually live in this household? For each: age, sex, relationship to head, education, main activity |
| Livelihoods | What were the household's main sources of income in the last 12 months? How many days did each member work for wages last month? |
| Agriculture | How much land does the household own and cultivate? Which crops were grown last season? |
| Assets and housing | What is the main material of the roof and walls? Does the household own a motorcycle, television, mobile phone, refrigerator? |
| Expenditure and debt | How much did the household spend on food last month? Does any member have an outstanding loan, and from whom? |
| Health | Did any member fall ill in the last 30 days? Where was treatment sought, and what did it cost? |
| Water, sanitation and energy | What is the main source of drinking water, and how far away is it? Does the household have a toilet? What fuel is used for cooking? |
| Services and schemes | Does the household have a ration card, health insurance or a bank account? Which government schemes does it benefit from? |
| Shocks and vulnerability | In the last year, did the household face crop loss, illness, job loss or other shocks? How did it cope? |
| Perceptions (for EIA or projects) | What does the household expect from the project? What concerns does it have? |
Each question needs a defined recall period, answer codes and a translated, piloted wording. See designing a baseline survey questionnaire for how to write them, and key socio-economic indicators for how the answers become indicators.
Who commissions one, and what they need it to answer
The term covers a family of studies with quite different purposes. Recognising which one you are commissioning changes the indicators, the sample and the report.
| Commissioner | The question behind the survey | What the report must support |
|---|---|---|
| Industrial project under EIA | Who lives here and how will they be affected? | A defensible chapter for the regulator |
| CSR or foundation programme | Did our spending change anything? | Board and statutory reporting |
| Government scheme evaluation | Is the scheme reaching intended beneficiaries? | Policy decisions and continuation |
| Development bank or donor | Did the intervention work, and for whom? | Funding decisions and log-frame targets |
| Company entering a new market | What can this population afford and want? | Pricing and product decisions |
| Land acquisition or resettlement | What is being lost, and by whom? | Compensation and R&R planning |
| Academic research | What relationships hold in this population? | Publication and thesis defence |
The distinction that matters most is between a survey that must describe a population and one that must detect change. A descriptive survey can be a single round with a modest sample. A change-detecting survey needs a baseline before the intervention starts, a matched endline, and enough sample in each to detect an effect worth acting on — decisions covered in what is a baseline survey and how to determine sample size.
The domains it measures
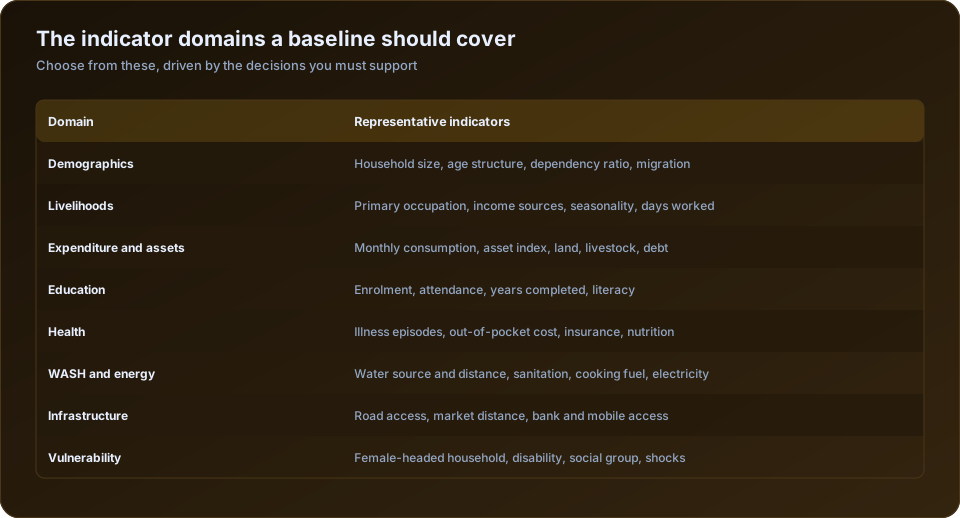
| Domain | Typical indicators | Why it appears |
|---|---|---|
| Demographics | Household size, age structure, dependency ratio, migration | The denominator for everything else |
| Livelihoods | Occupation, income sources, seasonality, days worked | The core of economic status |
| Expenditure and assets | Consumption, asset index, land, livestock, debt | More reliable than reported income |
| Education | Enrolment, attendance, years completed, literacy | Long-run mobility and programme targeting |
| Health | Illness episodes, out-of-pocket cost, insurance, nutrition | Vulnerability and shock exposure |
| WASH and energy | Water source and distance, sanitation, fuel, electricity | Direct quality-of-life measures |
| Infrastructure access | Road, market, bank, mobile network | Explains why outcomes vary by location |
| Social and vulnerability | Female-headed household, social group, disability, shocks | Identifies who is being left out |
Asset and expenditure data usually beat income data in Indian field conditions. Rural incomes are irregular, seasonal, drawn from several sources and routinely understated — partly from genuine uncertainty and partly from a reasonable suspicion about why a stranger is asking. Consumption expenditure and a simple asset index give a more stable picture, which is why national surveys lean on them.
What separates a real survey from a form-filling exercise
Four features, and a study missing any of them will struggle to hold up.
A defensible sampling frame. Whom could you have selected, and did every eligible household have a known chance of selection? A survey of whoever was home on a Tuesday afternoon systematically over-represents the elderly, the unemployed and women, and no sample size fixes it. See sampling methods for household surveys.
A piloted instrument. Questions that made sense in English at a desk frequently collapse in Bundelkhandi at a doorstep. Thirty to fifty pilot interviews reveal the failures cheaply.
Verifiable fieldwork. GPS stamps, timestamps, audio audits and independent back-checks on 10 to 15% of interviews. Without these, "the enumerator says they did it" is the entire quality system.
A documented analysis. Weights applied, design effects accounted for, and a cleaning log that lets anyone rebuild the clean dataset from the raw one.
What it costs and how long it takes
| Scale | Indicative cost (INR) | Elapsed time |
|---|---|---|
| 300 households, one block | 3,00,000 to 6,00,000 | 5 to 7 weeks |
| 1,000 households, one district | 8,00,000 to 18,00,000 | 8 to 12 weeks |
| 2,500 households, multi-district | 20,00,000 to 45,00,000 | 12 to 18 weeks |
| Baseline plus endline, 1,000 each | 18,00,000 to 35,00,000 | Two rounds, 12 to 24 months apart |
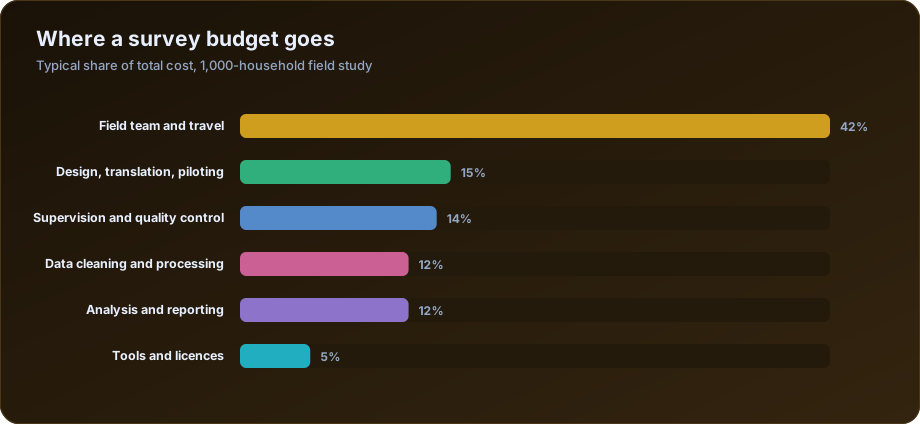
Field team and travel take the largest share of any budget, which is why geographic spread affects cost more than sample size does. Doubling the sample within the same twenty villages is far cheaper than keeping the sample and spreading it across sixty villages.
When you do not need one
Honest scoping saves money. You do not need a full socio-economic survey if:
- Secondary data already answers the question. Census, NFHS, NSS and district statistical handbooks cover a great deal, and are free. Always check before commissioning primary collection.
- You need depth rather than prevalence. Twenty qualitative interviews answer "why are people not enrolling" better than 800 questionnaires.
- The population is small enough to enumerate completely — 60 affected households is a census, not a sample.
- The decision has already been made and the survey is being commissioned to justify it. That is an expensive way to produce a document nobody trusts.
Methods Used in a Socio-Economic Survey
Most studies combine several methods, because each answers a different kind of question:
| Method | What it gives | Typical use |
|---|---|---|
| Household questionnaire (on tablets or paper) | Prevalence and averages with a margin of error | The core of almost every study |
| Focus group discussions | Shared views, norms and explanations | Why patterns occur; women's, youth or farmer groups |
| Key informant interviews | Expert and local-leader knowledge | Sarpanch, teachers, health workers, officials |
| Participatory rural appraisal tools | Resource maps, seasonal calendars, wealth ranking | Village-level context with community input |
| Village or facility checklists | Infrastructure and services | Schools, health centres, markets, roads |
| Secondary data | Context and benchmarks | Census, NFHS, NSS, district handbooks |
| Observation and GPS | Housing, assets and location | Verifying reported conditions, mapping |
The step-by-step process of combining these is covered in how to conduct a socio-economic survey.
An Illustrative Example: What a Survey Shows
Imagine a baseline of 400 households in 10 villages near a proposed industrial park in central India. A summary table from the report might look like this (figures are illustrative):
| Indicator | Result | What it tells the project |
|---|---|---|
| Average household size | 5.2 | Larger households, higher dependency |
| Households with agriculture as main income | 58% | Land acquisition will hit livelihoods directly |
| Landless households | 22% | A vulnerable group that land compensation will not reach |
| Households with a member migrating for work | 31% | Local job demand exists; skills mismatch likely |
| Adult literacy (women) | 54% | Training must suit low-literacy participants |
| Households using piped or tube-well water within premises | 39% | Water stress; community water is a strong CSR option |
| Households with a toilet in use | 71% | Sanitation progress, but gaps remain in two villages |
| Households with a member holding a bank account | 94% | Direct benefit transfers are feasible |
| Households facing a crop-loss shock in the last year | 27% | Livelihood fragility, seasonal vulnerability |
From a table like this, the project can see who will be affected and how, which groups need targeted support (the landless and migrant-worker households), what local hiring and skills training should look like, and which CSR investments matter most to the community. The same indicators, measured again later, show whether conditions improved.
Socio-Economic Surveys by Sector
The core indicators stay the same, but each sector adds its own focus:
- Mining and quarrying: land and forest dependence, tribal communities, displacement, health effects of dust, local employment.
- Highways and railways: affected structures along the alignment, roadside livelihoods, severance of villages, road safety.
- Renewable energy parks: land leasing and sale, grazing land, pastoral communities, local hiring during construction.
- Dams, canals and irrigation: submergence, resettlement, downstream water users, fishing communities.
- Industrial parks and plants: land loss, employment expectations, migrant labour, air and water concerns.
- Urban and real estate projects: informal settlements, street vendors, traffic and services.
- CSR and development programmes: the outcomes the programme targets, such as income, school attendance, health or water access.
Ethics and Data Protection
A socio-economic survey collects personal and sometimes sensitive information: income, debt, health, caste, disability, migration. That brings responsibilities:
- Informed consent. Every respondent is told who is collecting the data, why, how it will be used and that they can refuse or stop. Consent is recorded.
- Data protection. India's Digital Personal Data Protection Act, 2023 applies to personal data collected in digital form. Names, phone numbers, GPS points and photos should be stored securely, access limited, and identifiers removed before data is shared.
- Sensitive questions. Caste, religion, disability and health questions should be asked only when the purpose needs them, with careful wording and trained enumerators.
- Children and vulnerable people. Additional safeguards apply, such as interviewing children only with a parent's consent.
- Expectations. Respondents near a project often expect compensation or jobs because they were surveyed. Enumerators must explain clearly what the survey is and is not.
A survey agency should be able to show its consent procedure, data security arrangements and enumerator training on these points.
Socio-Economic Survey vs Related Studies
| Study | How it differs from a socio-economic survey |
|---|---|
| Census | Covers every household rather than a sample; no sampling error, but expensive for large populations |
| Baseline survey | A socio-economic survey timed before an intervention and designed to be repeated |
| Social impact assessment | Uses socio-economic data but goes further: predicts impacts, consults affected people and sets out a management plan |
| Market research | Focuses on consumers, demand and prices rather than living conditions |
| Needs assessment | Focuses on gaps and priorities for a programme, often with more qualitative work |
| Livelihood study | A narrower survey on income sources, skills and work patterns |
In practice the terms overlap, and one well-designed study can serve several purposes, for example providing both the EIA socio-economic profile and the baseline for a company's later CSR programme.
Choosing a Socio-Economic Survey Agency in India
If you are commissioning a survey rather than running it, the agency's methods matter more than its brochure. Ask:
- How will the sample be drawn? Look for a written sampling plan with the frame, sample size calculation and selection method.
- Who are the enumerators? Local-language speakers, trained for several days, with a supervisor for every five to eight enumerators.
- How is quality checked? Back-checks on at least 10% of interviews, GPS and time stamps, audio audits and daily data review.
- Is there a pilot? A pilot round to test the questionnaire before full fieldwork.
- What will you receive? A clean dataset with a codebook and cleaning log, indicator tables and a report, not just raw data.
- Who analyses and writes? Named analysts with experience of the report type you need, such as an EIA chapter or an impact evaluation.
- How are consent and data security handled?
Our guides on choosing a household survey agency and socio-economic survey costs go into more detail.
How Long Is Socio-Economic Data Valid?
Socio-economic conditions change, sometimes quickly, so survey data has a shelf life:
- For EIA and clearance work, Indian practice generally expects primary baseline data to be recent, commonly within about three years of the application. Older data usually needs updating, at least with a smaller verification survey.
- For impact evaluation, the baseline must be collected before the intervention starts. Data collected after activities begin cannot serve as a true baseline.
- After a major shock, such as a flood, drought, pandemic or a large new employer arriving, earlier data may no longer describe the population, even if it is recent.
- Secondary data ages too. Census 2011 figures are now well over a decade old, which is one reason projects increasingly collect their own primary data.
When in doubt, a short verification round on a subsample of households is far cheaper than relying on data a reviewer will reject.
Socio-Economic Survey Report Format
A socio-economic survey report usually follows this structure, adapted to the purpose:
- Executive summary with the main findings and what they mean for the decision.
- Introduction: the project or programme, objectives of the survey and the study area.
- Methodology: sampling frame, sample size and selection, questionnaire, fieldwork dates, quality control, weighting and limitations.
- Demographic profile: household size, age and sex structure, social groups, migration.
- Economic profile: occupations, income sources, expenditure, assets, land and livestock, debt.
- Education and health: literacy, enrolment, illness, access to and cost of care.
- Housing, amenities and services: water, sanitation, electricity, cooking fuel, roads, markets, banking.
- Vulnerable groups: female-headed households, the landless, people with disabilities, households facing recent shocks.
- Community perceptions: findings from focus groups and key informant interviews.
- Conclusions and recommendations, linked back to the objectives, with annexes for the questionnaire, sample list, maps and detailed tables.
For an EIA, the same content is usually condensed into the socio-economic chapter, alongside Census data for the wider study area.
From survey to evidence
The output that matters is not the dataset but the interpretation. A good report answers the commissioning question directly, shows the indicator tables and maps behind the answer, states the confidence intervals, and is explicit about who was missed and why.
For the execution sequence see how to conduct a socio-economic survey step by step; for the EIA context specifically, socio-economic surveys in environmental impact assessment. Our socio-economic and baseline survey service runs these studies end to end from Indore. For national benchmarks and comparison data, the Ministry of Statistics and Programme Implementation publishes NSS methodology and results, and the National Family Health Survey provides district-level indicators worth checking before you field anything.
Frequently Asked Questions
What is a socio-economic survey?
A structured study of the social and economic conditions of a defined population — demographics, livelihoods, income and expenditure, education, health, services and vulnerability — collected through a sampled household questionnaire and analysed to support a specific decision.
What is the meaning of a socio-economic survey?
It is a survey that measures both the social conditions (population, education, health, housing, services) and the economic conditions (income, occupation, expenditure, assets) of a group of people, to describe them and to plan or evaluate projects and policies.
What are the types of socio-economic surveys?
Common types are baseline and endline surveys, socio-economic profiles for EIA, social impact assessments, censuses of affected households, livelihood and market surveys, and rapid monitoring surveys.
What is the Kuppuswamy scale?
A widely used Indian scale that classifies a family's socio-economic status into five classes using the education and occupation of the head of household and the total monthly family income. Its income brackets are updated regularly using the consumer price index.
What questions are asked in a socio-economic survey?
Questions on the household roster (age, sex, education, occupation of each member), income sources, land and livestock, housing and assets, expenditure and debt, health and illness, water, sanitation and cooking fuel, access to services and government schemes, recent shocks, and, for projects, expectations and concerns.
Can a socio-economic survey be done by phone?
Short follow-up or monitoring surveys can, where most households have phones. A full baseline is normally done face-to-face, because it needs observation of housing and assets, longer interviews and reliable coverage of households without phones.
What is the difference between a socio-economic survey and a census?
A survey collects data from a sample and infers to the population, with a quantified margin of error. A census covers every unit. Surveys are used when the population is large; a census is appropriate when the affected group is small enough to enumerate completely.
Who needs a socio-economic survey?
Industrial projects preparing an EIA, companies reporting on CSR spending, government scheme evaluations, development banks and donors funding interventions, and organisations planning resettlement or compensation. Academic researchers use the same methods for population studies.
How much does a socio-economic survey cost in India?
Roughly 3 to 6 lakh for 300 households in one block, 8 to 18 lakh for 1,000 households across a district, and 20 to 45 lakh for a multi-district study of 2,500. Geographic spread drives cost more than sample size does.
How long does a socio-economic survey take?
Five to seven weeks for a small single-block study and eight to twelve weeks for a 1,000-household district survey, covering design, piloting, training, fieldwork, cleaning and reporting. Fieldwork itself is usually the shortest phase.
What data does a socio-economic survey collect?
Household demographics, occupation and income sources, expenditure and assets, education and literacy, health and nutrition, water, sanitation and energy access, infrastructure and services, and vulnerability markers such as female-headed households, disability and recent shocks.
How DSTechnoverse Runs Your Survey
DSTechnoverse is a full-service socio-economic and baseline survey agency based in Indore. We do not just advise — we run the whole study end to end and hand you evidence you can defend:
- Design — objectives, indicators, and sampling (random, stratified, cluster, or multi-stage), with a piloted questionnaire translated into local languages.
- Field data collection — trained enumerators using CAPI (tablet) tools such as KoBoToolbox, ODK, and SurveyCTO-style apps, with GPS stamping, audio audits, and built-in skip-logic validation.
- Quality control — back-checks, spot-checks, and daily high-frequency data monitoring so problems are caught in the field, not after.
- Analysis — SPSS, R, Python, and Excel for indicators, cross-tabulations, and impact estimates, including baseline–endline difference-in-differences.
- A detailed report — cleaned datasets, indicator tables, charts, GIS maps, and clear interpretation, with interactive Power BI / Tableau dashboards on request.
Our survey experience in Indore includes Smart City citizen-feedback surveys, Startup India & MSME surveys, Swachh Survekshan (Swachh Bharat) cleanliness surveys, and skill-development impact evaluations — delivered for government, municipal, corporate, and NGO clients.
Planning a socio-economic, baseline, endline, or willingness-to-pay survey? Talk to our survey team for a scope and quote.
Sources and Further Reading
Official and primary sources for the standards, rules and data discussed on this page.
- J-PAL Research Resources: practical guides to impact evaluation and survey design.
- World Bank DIME Wiki: field survey, data quality and impact evaluation guidance.
- UCLA Statistical Methods and Data Analytics: worked examples for SPSS, R, Stata and SAS.
- NIST/SEMATECH e-Handbook of Statistical Methods: a free reference on statistical methods and tests.