Air quality analysis is the discipline that sits between a measurement and a decision. A monitor produces a number; analysis decides whether that number means a community is safe, an industry is compliant, a control measure worked, or an entire city's action plan is on track. Done well, it is one of the most consequential forms of environmental data work there is. Done badly, it produces confident-looking charts that fall apart the moment a regulator, a court, or a competent reviewer asks how the data was validated.
This guide is a complete walk-through of air quality analysis as it is actually practised: the parameters that get measured and why, the monitoring methods behind them, the statistical machinery used to interpret the data, the standards results are judged against, the studies and methodologies that underpin the field, and the specific ways things go wrong. It is written for environmental consultants, EHS and compliance managers, EIA teams, researchers, municipal officials, and anyone who has been handed a spreadsheet of concentrations and asked to explain what it means.
Air quality analysis is the systematic collection, validation, statistical treatment and interpretation of atmospheric pollutant data to determine ambient concentrations, identify sources, quantify trends and exposure, and assess compliance against standards such as India's National Ambient Air Quality Standards (NAAQS) or the WHO Air Quality Guidelines. It combines monitoring data, meteorology, chemical speciation, dispersion modelling and geospatial methods to convert raw measurements into defensible conclusions.
What Exactly Does "Air Quality Analysis" Cover?
The phrase is used loosely, so it helps to be precise. In professional practice, air quality analysis spans six distinct activities, and most real projects use several at once.
- Descriptive analysis — what were the concentrations, when, and where? Means, maxima, percentiles, exceedance counts, diurnal and seasonal profiles.
- Compliance analysis — do those concentrations meet the applicable standard, using the correct averaging period and the correct data-capture rule?
- Trend analysis — is the situation improving or deteriorating, and is the change statistically real once weather is accounted for?
- Source analysis — which activities, sectors or locations are responsible for the measured burden?
- Predictive analysis — what will concentrations be tomorrow, or after a proposed plant is commissioned, or under a policy scenario?
- Exposure and impact analysis — how many people breathe what, and what health or ecological consequence follows?
A study that answers only the first two is a monitoring report. A study that answers four or more is an air quality analysis. Clarifying which of the six you actually need is the single most useful thing you can do before commissioning work, because it determines the parameters, the monitoring duration, the instruments and the budget.
What Parameters Are Measured in Air Quality Analysis?
Parameters fall into five families. Analysts who only think about particulate matter routinely miss the variables that explain their own data.
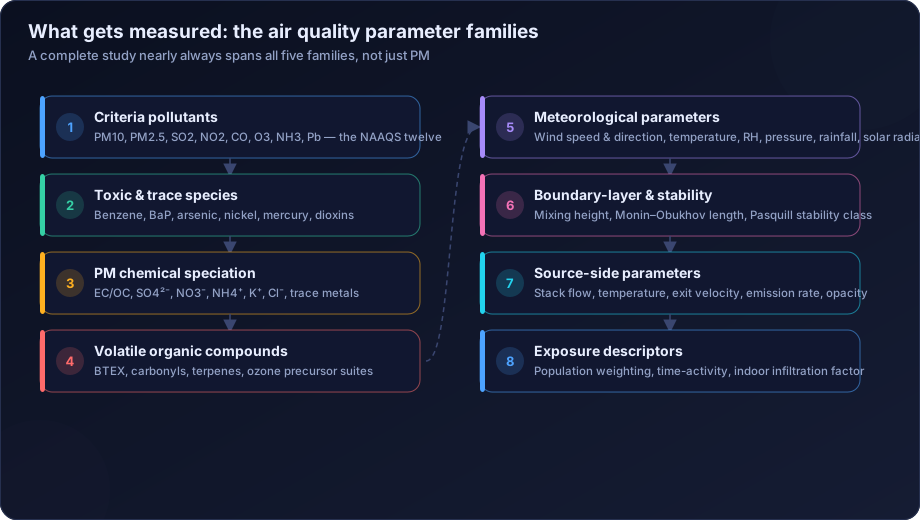
1. Criteria pollutants
These are the pollutants for which health-based ambient standards exist. India's NAAQS, notified by the Central Pollution Control Board, covers twelve parameters. The eight that dominate routine work are:
| Parameter | Symbol | Typical averaging periods | Why it matters |
|---|---|---|---|
| Particulate matter ≤ 10 µm | PM10 | 24-hour, annual | Coarse dust, construction, road resuspension |
| Particulate matter ≤ 2.5 µm | PM2.5 | 24-hour, annual | Deepest lung penetration; strongest health signal |
| Sulphur dioxide | SO2 | 1-hour, 24-hour, annual | Fuel sulphur, smelting; secondary sulphate precursor |
| Nitrogen dioxide | NO2 | 1-hour, 24-hour, annual | Combustion, traffic; ozone and nitrate precursor |
| Carbon monoxide | CO | 1-hour, 8-hour | Incomplete combustion; acute toxicity |
| Ozone | O3 | 1-hour, 8-hour | Secondary photochemical pollutant |
| Ammonia | NH3 | 1-hour, 24-hour | Agriculture, fertiliser; drives ammonium aerosol |
| Lead | Pb | 24-hour, annual | Neurotoxic; smelters, battery recycling |
For comparison, the WHO Air Quality Guidelines 2021 set considerably stricter health-based values, notably 5 µg/m³ for annual PM2.5 against India's 40 µg/m³. The remaining four NAAQS parameters — benzene, benzo(a)pyrene, arsenic and nickel — are toxics measured over longer periods and are covered in our guide to NAAQS standards in India.
2. Chemical speciation of particulate matter
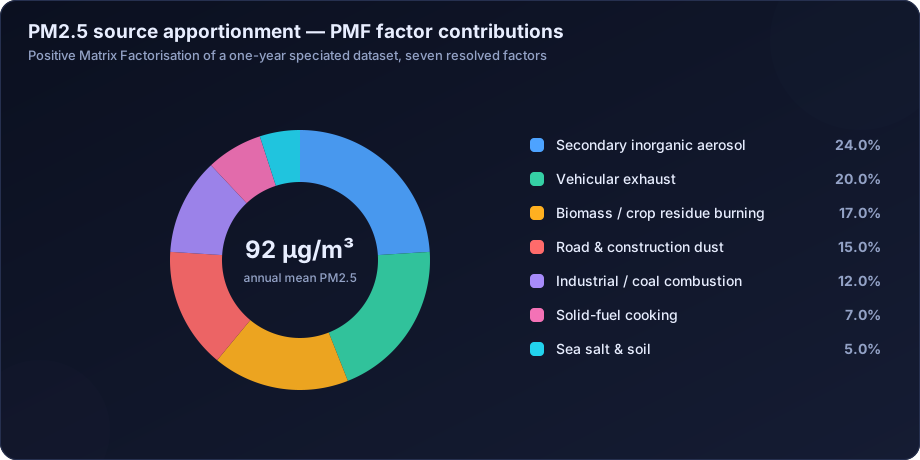
PM mass alone tells you how much, never what. Speciation resolves the filter into elemental and organic carbon (EC/OC), water-soluble ions (sulphate, nitrate, ammonium, chloride, potassium), and trace metals. This is the raw material for source apportionment, because each source leaves a distinctive fingerprint — potassium for biomass burning, elemental carbon for diesel, calcium for crustal dust.
3. Volatile organic compounds
BTEX (benzene, toluene, ethylbenzene, xylenes), carbonyls and biogenic terpenes matter both as direct toxics and as ozone precursors. VOC analysis requires canister or sorbent-tube sampling followed by GC-MS, and is routinely skipped in Indian studies even where a petrochemical or solvent-using facility makes it essential.
4. Meteorological parameters
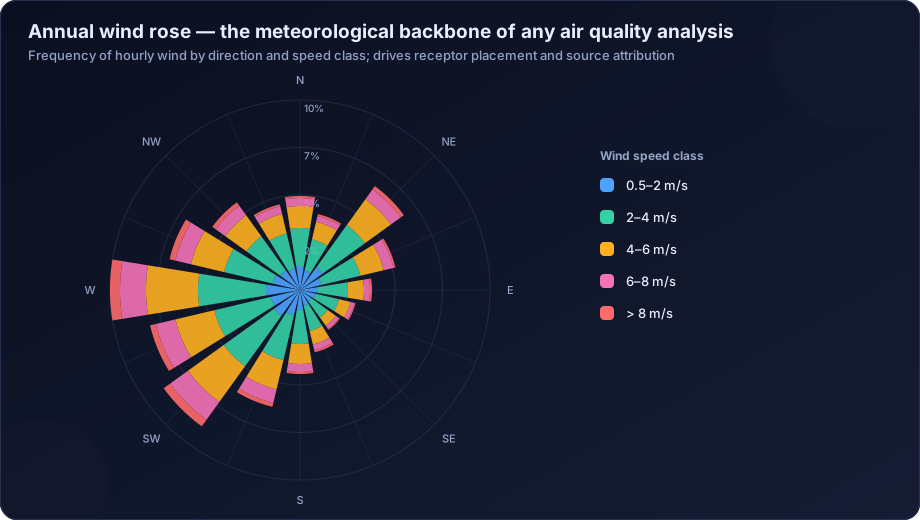
Wind speed, wind direction, temperature, relative humidity, barometric pressure, rainfall and solar radiation are not optional context — they are analytical variables. Without them you cannot build a wind rose, cannot attribute a plume to a direction, cannot normalise a trend, and cannot run a dispersion model. Our note on meteorological data for air modelling in India covers sourcing and validation.
5. Boundary-layer and stability parameters
Mixing height, Monin–Obukhov length and Pasquill stability class determine the volume of air available for dilution. A winter night with a 150 m mixing height and a summer afternoon with a 2,000 m mixing height can produce a tenfold difference in concentration from identical emissions. Any analysis that reports a winter–summer difference without discussing boundary-layer behaviour has not finished the job.
How Is Air Quality Data Actually Collected?
Four measurement approaches dominate, and each has a distinct accuracy–coverage–cost signature. Serious studies combine them rather than defending one.
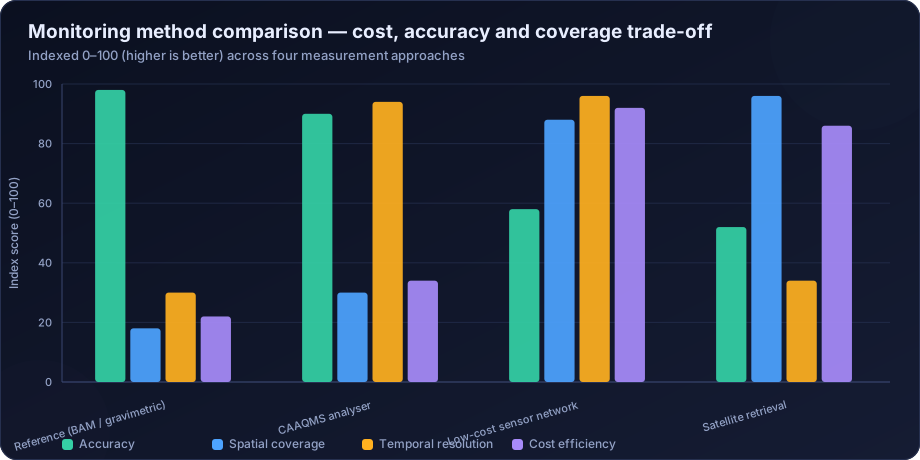
Reference methods — gravimetric filter sampling for PM (weighed on a microbalance in a conditioned room) and beta attenuation monitors — are the accuracy benchmark. They are slow, labour-intensive and give you one point in space.
Continuous analysers in a CAAQMS cabin deliver hourly or sub-hourly data across many parameters simultaneously. India's national network streams to the CPCB CAAQMS dashboard, and the analytical challenges of that data are covered in our CAAQMS data analysis guide.
Low-cost sensors buy spatial density at the cost of accuracy. They are genuinely useful — for hotspot screening, for community engagement, for gradient mapping — provided they are calibrated against a reference and their drift is managed. See low-cost air quality sensor calibration.
Satellite retrievals such as MODIS/MAIAC aerosol optical depth and Sentinel-5P TROPOMI column measurements give complete spatial coverage where no monitor exists, at the cost of one or two observations per day and a non-trivial conversion problem. See satellite air quality data analysis.
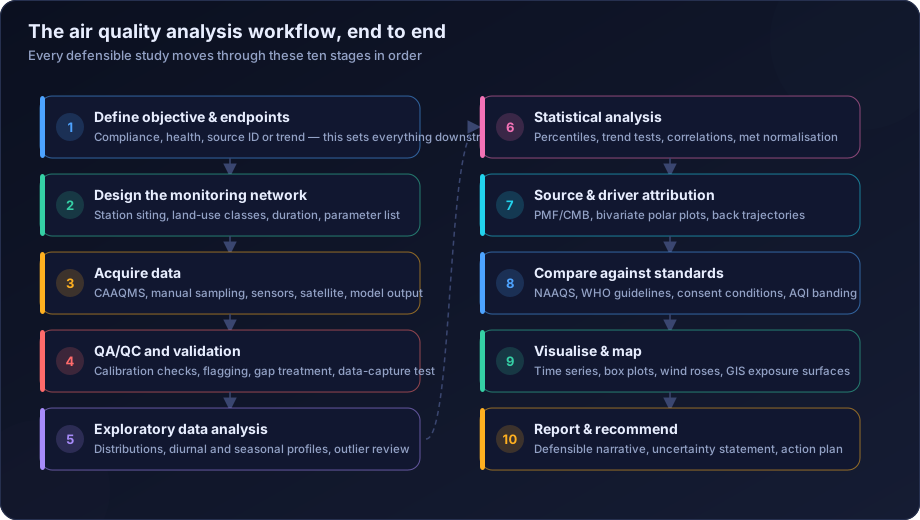
The Analytical Methodology, Step by Step
The methodology below is what a competent consultancy follows. Each step exists because skipping it has burned somebody.
Step 1 — Fix the objective and the endpoint
Write down the exact question. "Is the plant compliant with the 24-hour PM10 standard at the nearest residential receptor over one calendar year?" is a specification. "Check the air quality" is not. The endpoint determines averaging period, station count, duration, and every downstream statistic.
Step 2 — Design the network
Station siting follows land-use logic: industrial, traffic/kerbside, residential, urban background, and at least one upwind or rural reference. The reference station is what lets you separate a local source from a regional airmass — omit it and you cannot make attribution claims. Duration follows the standard: annual averages require a full year, and seasonal studies for EIA typically follow one non-monsoon season, as described in our guide to ambient air quality monitoring for EIA in India.
Step 3 — Acquire and archive raw data
Raw data is archived unmodified and never overwritten. All validation happens on a working copy, with an audit trail. This one habit is the difference between a dataset that survives scrutiny and one that does not.
Step 4 — QA/QC and validation
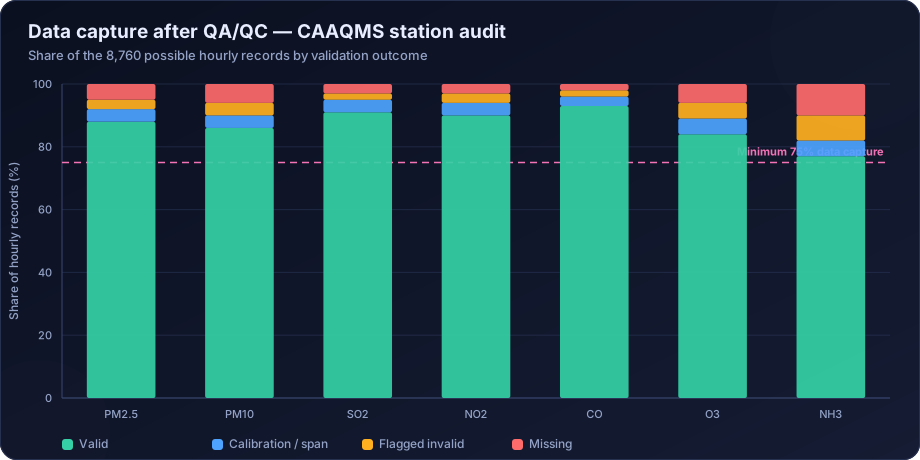
Instrument status flags, range and plausibility tests, rate-of-change tests, internal consistency (PM2.5 must not exceed PM10; NO must not exceed NOx), cross-station coherence, and calibration traceability. Then the data-capture rule: most standards require at least 75% valid data in an averaging period before a mean may be published. Full treatment in QA/QC for air quality monitoring data.
Step 5 — Exploratory data analysis
Before any test, look at the data. Plot the distribution — air quality data is almost always right-skewed and approximately log-normal, which immediately rules out naive use of the mean and standard deviation. Plot the diurnal cycle, the weekly cycle, the seasonal cycle. Plot each station against the others.
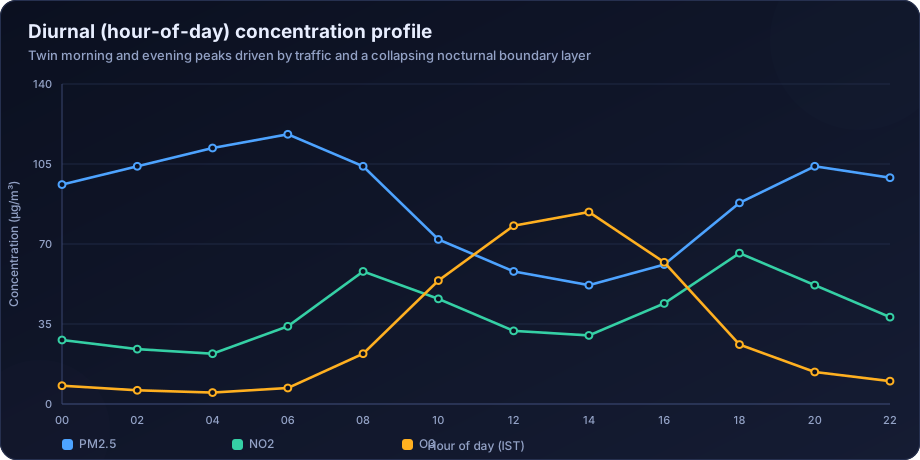
The diurnal profile above is diagnostic on its own. The pre-dawn PM2.5 maximum with a mid-afternoon minimum is the signature of boundary-layer control, not of emissions — emissions do not peak at 04:00. Ozone peaking at 14:00 while NO2 dips is the classic photochemical signature. Reading these shapes correctly is a large part of the analyst's skill.
Step 6 — Statistical analysis
This is where the discipline lives:
- Central tendency and spread — geometric mean and percentiles, not just the arithmetic mean, because of the skew.
- Percentile-based compliance — many standards are written as "not to be exceeded more than 2% of the time", which is the 98th percentile test.
- Trend testing — the non-parametric Mann–Kendall test with a Theil–Sen slope estimator, because air quality data violates the normality assumptions of ordinary regression. Covered in air quality trend analysis methods.
- Meteorological normalisation — separating a real emissions change from a favourable weather year, covered in meteorological normalisation of air quality data.
- Correlation and multivariate analysis — PM2.5/PM10 ratios, NOx/CO ratios, principal components, and factor models.
Step 7 — Source and driver attribution
Bivariate polar plots, conditional probability functions, back-trajectory clustering, and receptor models such as Positive Matrix Factorisation. The US EPA's PMF model documentation remains the standard reference.
Step 8 — Comparison against standards
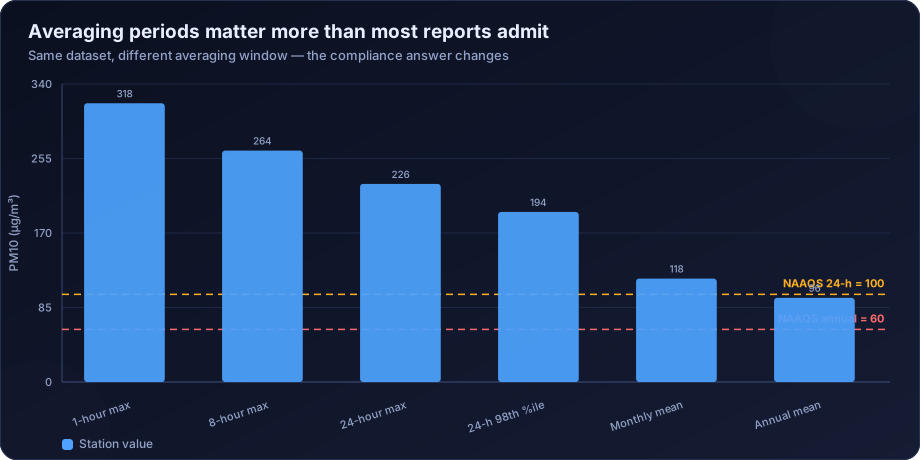
Compare like with like. A 24-hour standard is compared against 24-hour averages, not hourly maxima. An annual standard requires a full year with adequate capture. Adding an incremental model prediction to a measured baseline is a specific procedure used in cumulative impact assessment.
Step 9 — Spatial analysis and mapping
Interpolation onto a grid (IDW, kriging), overlay with population, land use and sensitive receptors, and production of exposure surfaces. See air quality GIS mapping and spatial interpolation.
Step 10 — Report, quantify uncertainty, recommend
A finished analysis states its own limitations: data capture achieved, instruments used, calibration history, methods applied, and the confidence attached to each conclusion. Analyses that read as certain about everything are the least trustworthy.
Which Standards and Guidelines Do Results Get Judged Against?
| Framework | Issued by | Nature | Typical use |
|---|---|---|---|
| NAAQS 2009 | CPCB, India | Legally enforceable | Compliance, EC/consent, EIA |
| WHO Air Quality Guidelines 2021 | World Health Organization | Health-based, non-statutory | Health-risk framing, aspiration |
| National AQI | CPCB | Public communication | Daily reporting, advisories |
| Emission standards (industry-specific) | CPCB / MoEFCC | Source-side, enforceable | Stack and CEMS compliance |
| Consent conditions | State Pollution Control Board | Site-specific, enforceable | Operational compliance |
| ISO 16000 series | ISO | Method standards | Indoor air quality |
The 2021 WHO Air Quality Guidelines revised the annual PM2.5 guideline down to 5 µg/m³, roughly eight times stricter than India's 40 µg/m³ NAAQS. Both numbers are legitimate and they answer different questions: WHO describes where health risk becomes small, NAAQS describes what is legally enforceable in the Indian context today. Reporting one while implying the other is a common and avoidable analytical error.
How Analysis Turns Into Decisions
The point of the exercise is not the report. In practice, air quality analysis drives five decision types:
- Regulatory — grant, refuse or condition an Environmental Clearance or consent, informed by air quality modelling for environmental clearance.
- Engineering — size a bag filter, set a stack height, choose a fuel. Analysis of existing performance feeds directly into stack height calculation under CPCB guidelines.
- Policy — target the sectors that actually dominate the burden. Source apportionment routinely overturns intuitions about which sector matters most in a given city.
- Operational — trigger construction dust controls, adjust process load, or issue a health advisory when a forecast crosses a threshold.
- Legal and reputational — defend a position with data that has an audit trail.
What Goes Wrong: The Failure Modes Worth Knowing
- Averaging over invalid data. A monthly mean computed from 40% data capture is not a monthly mean. It is a number.
- Using the arithmetic mean on a log-normal distribution and then reasoning about "typical" conditions.
- Comparing a 1-hour maximum against a 24-hour standard, which inflates apparent exceedance dramatically.
- Ignoring meteorology, then attributing a good year to a control measure that had not yet been commissioned.
- Treating raw low-cost sensor output as equivalent to reference data, usually overstating concentrations by 20–60% at high humidity.
- Sampling only the non-monsoon season and reporting it as an annual picture.
- No upwind reference station, making source attribution unprovable.
- Undocumented gap filling, where interpolated values silently become "measurements".
Each of these has appeared in reports that were rejected, challenged, or quietly disbelieved. None of them are exotic.
Studies and Evidence That Shape the Field
Air quality analysis rests on a substantial evidence base, and citing it correctly strengthens any report:
- The Global Burden of Disease programme, published through IHME, provides the concentration–response functions used in most burden calculations.
- The State of Global Air reports, produced by the Health Effects Institute, translate those functions into national estimates and are available at stateofglobalair.org.
- The Lancet Planetary Health India State-Level Disease Burden Initiative quantified the health and economic burden of air pollution across Indian states, and remains the most-cited national reference.
- The US EPA's air data and methods documentation, at epa.gov/outdoor-air-quality-data, defines much of the measurement and validation practice adopted internationally.
- CPCB's own National Air Quality Index technical report defines the sub-index breakpoints used across India — see our worked walk-through in how to calculate the AQI in India.
How DSTechnoverse Helps With Air Quality Analysis
DSTechnoverse works as a specialist air quality analysis desk for environmental consultancies, industries, EPC contractors and research teams across India. Our position is simple: the measurement is only half the deliverable, and the analysis is where studies are won or lost.
What we do
- Data validation and QA/QC — we take raw CAAQMS exports, manual monitoring sheets, sensor logs or laboratory results and return a validated, flagged, versioned dataset with a documented data-capture statement.
- Statistical analysis — descriptive statistics, percentile and exceedance analysis, Mann–Kendall and Theil–Sen trend testing, meteorological normalisation, correlation and multivariate analysis, all executed in R and Python so every figure is reproducible.
- Source apportionment — chemical speciation interpretation, PMF and CMB receptor modelling, bivariate polar plots and back-trajectory analysis.
- Dispersion modelling — AERMOD, AERMET, AERMAP, BPIP-PRIME and CALPUFF for predictive and cumulative assessment, delivered through our AERMOD air dispersion modelling service.
- GIS and mapping — receptor grids, interpolation surfaces, isopleth maps and population-weighted exposure layers.
- Reporting — regulator-ready chapters written to CPCB, SPCB, MoEFCC and EIA expectations, with methods, assumptions and limitations documented in full.
How we work. We start with a scoping call that pins down the endpoint, the standard and the deadline. We audit the incoming data before promising anything, because a dataset with 45% capture cannot support an annual conclusion no matter how good the analyst is. We then run the analysis in a scripted, reproducible pipeline, review internally against the applicable standard, and deliver both the report and the underlying working files — so your team owns the analysis, can rerun it, and can defend it.
What you receive. A validated dataset, a statistical annexure, publication-quality figures (time series, box plots, wind roses, heatmaps, contour maps), comparison tables against the applicable standard, an interpretation narrative written for a non-specialist reviewer, and a limitations and uncertainty statement.
We work as a confidential white-label partner where required, so consultancies can add air quality analysis capacity without adding headcount — the same model described in our EIA data analysis outsourcing service.
Need air quality data turned into a defensible answer? DSTechnoverse provides end-to-end air quality analysis services — monitoring data validation, statistical analysis, source apportionment, dispersion modelling, GIS mapping, and regulator-ready reporting. Talk to our air quality team about your dataset or project.
Frequently Asked Questions
What is air quality analysis in simple terms?
It is the process of turning air pollution measurements into meaningful conclusions. It covers validating the raw data, calculating the right statistics for the right averaging periods, comparing results against standards such as NAAQS, identifying where the pollution came from, and explaining what the numbers mean for health, compliance and decision-making.
What are the main air quality parameters?
The core parameters are PM10, PM2.5, SO2, NO2, CO, O3, NH3 and lead, which are covered by India's NAAQS. Comprehensive studies add benzene and other toxics, PM chemical speciation (EC/OC, ions, trace metals), VOCs, and the meteorological parameters — wind speed and direction, temperature, humidity and mixing height — without which the pollutant data cannot be properly interpreted.
How long should air quality monitoring run before analysis is meaningful?
It depends on the endpoint. Comparison against a 24-hour standard needs enough valid days to characterise the distribution — typically a full season at minimum. Comparison against an annual standard needs a full calendar year with at least 75% data capture. Short campaigns of a few days can only support screening conclusions, never compliance statements.
What is the difference between air quality monitoring and air quality analysis?
Monitoring is the act of measuring — running the instruments, collecting filters, recording concentrations. Analysis is what happens afterwards: validating those measurements, computing statistics, testing trends, attributing sources, comparing against standards and interpreting the result. Monitoring produces data; analysis produces answers.
Which software is used for air quality data analysis?
R with the openair package is the most widely used specialist toolkit, and Python with pandas, scipy and scikit-learn covers everything from data cleaning to machine-learning forecasts. Dispersion modelling uses AERMOD or CALPUFF, spatial work uses QGIS or ArcGIS, and receptor modelling uses EPA PMF. Spreadsheets are adequate for small compliance checks and inadequate for anything reproducible.
Is air quality analysis required for Environmental Clearance in India?
Yes. Projects requiring an EIA under the EIA Notification 2006 must present baseline ambient air quality data, analyse it against NAAQS, and predict incremental impacts through dispersion modelling. The analysis chapter is one of the most closely scrutinised parts of the submission, and weak data validation is a frequent cause of appraisal queries.
How do you know whether an improvement in air quality is real?
By separating the emissions signal from weather. A mild, windy, wet year lowers concentrations without any policy doing anything. Meteorological normalisation — using a statistical model to hold weather constant — plus a non-parametric trend test such as Mann–Kendall gives a defensible statement about whether the underlying change is real and statistically significant.
Can low-cost sensors be used for regulatory air quality analysis?
Not for compliance determination, which requires reference or equivalent methods. Low-cost sensors are valuable for spatial screening, hotspot identification, community awareness and gradient mapping, provided they are co-located with a reference monitor, calibrated, and reported with their known uncertainty. Presenting raw sensor output as regulatory-grade data is the most common misuse in the field.
Related services
Related articles
- Air Quality Parameters Explained: PM2.5, PM10, SO2, NO2, CO, O3, NH3, Lead and Beyond
- Ambient Air Quality Data Analysis for EIA: Methods and Standards
- Air Quality Compliance Reporting Against NAAQS: Percentiles, Exceedances and Defensible Statistics
- Air Quality Forecasting with Machine Learning: Models, Features and Honest Validation