"The annual average was 58 µg/m³, below the standard of 60, so the station is compliant." That sentence appears in a great many Indian air quality reports and it is, on its own, insufficient. India's NAAQS contains two independent tests — an annual mean test and a 98th-percentile short-term test — plus a consecutive-day rule and a minimum measurement requirement. A station can pass the annual test and fail compliance outright. Getting this right is not pedantry; it is the difference between a report that supports a consent application and one that invites a query.
This guide covers compliance determination against NAAQS in full: what the standards actually say, how each test is computed, the data requirements that underpin them, worked examples, how compliance interacts with Environmental Clearance and consent conditions, and the calculation errors that recur across the industry.
Air quality compliance reporting against NAAQS is the determination of whether measured ambient concentrations meet India's National Ambient Air Quality Standards, applying both the annual arithmetic mean test and the 98th-percentile short-term test, subject to minimum measurement frequency and data capture requirements, and the rule that short-term limits must not be exceeded on two consecutive days.
What the Standards Actually Require
The NAAQS 2009 notification sets limits for twelve parameters. Each has an averaging period, a limit value, and conditions on how the limit is applied. The full table is in NAAQS standards in India explained; the compliance mechanics are here.
The two tests
Annual test. The annual arithmetic mean must not exceed the annual limit. The mean must be derived from a minimum of 104 measurements taken twice a week at uniform intervals — for manual monitoring — or from continuous monitoring with adequate data capture across the year.
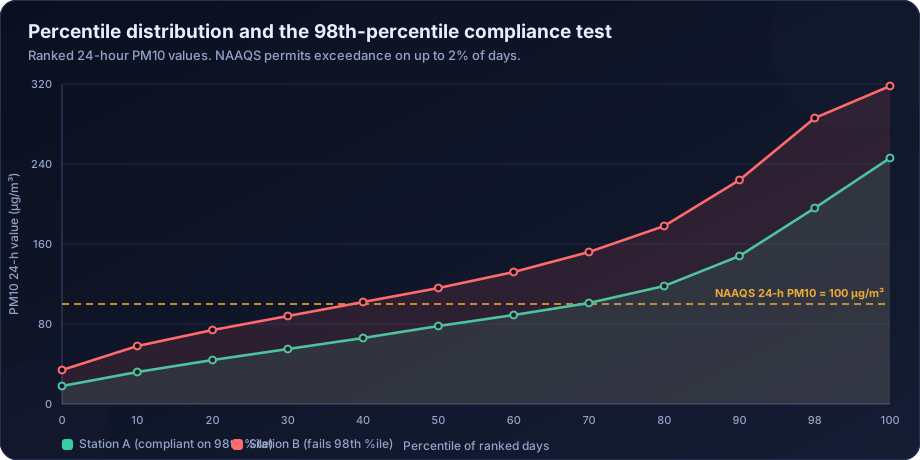
Short-term test. The 24-hour (or 1-hour, or 8-hour, as specified) limit may be exceeded on 2% of the time, but not on two consecutive days of monitoring.
Both tests must be passed. Failing either is non-compliance.
What "2% of the time" means in practice
For a full year of daily 24-hour values, 2% of 365 days is approximately 7 days. The operational test is the 98th percentile of the ranked valid 24-hour values: if the 98th percentile is at or below the limit, the short-term test is satisfied.
For a monitoring programme with 104 measurements (twice weekly), 2% is approximately 2 measurements. The percentile is computed over the valid measurements actually taken, not over calendar days.
The consecutive-day rule
This is the condition most often overlooked, and it is not a percentile test at all. Even if only 5 days out of 365 exceed the limit — comfortably within 2% — if any two of those fall on consecutive monitoring days, the standard is not met.
The rule exists because two consecutive days of high concentration represent a sustained episode with materially different health implications from five isolated spikes. Compliance analysis must therefore check the exceedance dates for adjacency, not just count them.
Computing the Tests Correctly
Step 1 — Validate first
No compliance statistic may be computed from unvalidated data. Calibration periods, faults, out-of-range values and internal-consistency failures must be flagged and excluded first. See QA/QC for air quality monitoring data.
Step 2 — Build correct averaging-period values
| Statistic | Construction | Minimum valid input |
|---|---|---|
| 24-hour average | Calendar day mean, midnight to midnight IST | 18 of 24 hourly values (75%) |
| 8-hour maximum (O3, CO) | Maximum of all rolling 8-hour means within the day | 6 valid hours per window |
| 1-hour maximum | Highest valid hourly value in the period | Valid hour |
| Annual mean | Mean of valid 24-hour values across the year | 75% of days, distributed across seasons |
The 8-hour maximum is a rolling maximum. Computing three fixed 8-hour blocks and taking the largest systematically under-reports and is a common error.
Step 3 — Compute the annual mean
Arithmetic mean of the valid 24-hour values. Report alongside it: the number of valid days, the data capture percentage, and the seasonal distribution of valid data.
Step 4 — Compute the 98th percentile
Rank the valid 24-hour values in ascending order and take the value at the 98th percentile. Because different percentile interpolation conventions exist, state the method used — the linear-interpolation convention is standard and matches the default in R and Python's numpy.
Step 5 — Check the consecutive-day rule
List every exceedance date. Check for adjacency. Report the longest run.
Step 6 — State data capture
Compliance conclusions from a dataset with 52% capture are not conclusions. The capture figure belongs in the compliance table itself, not in an annexure.
A Worked Compliance Assessment
A continuous station, one calendar year, PM10.
| Metric | Value | Standard | Result |
|---|---|---|---|
| Valid days | 331 of 365 | — | 90.7% data capture |
| Seasonal distribution | Winter 88%, summer 93%, monsoon 89%, post-monsoon 93% | Reasonable spread | Acceptable |
| Annual arithmetic mean | 96 µg/m³ | 60 µg/m³ | FAIL |
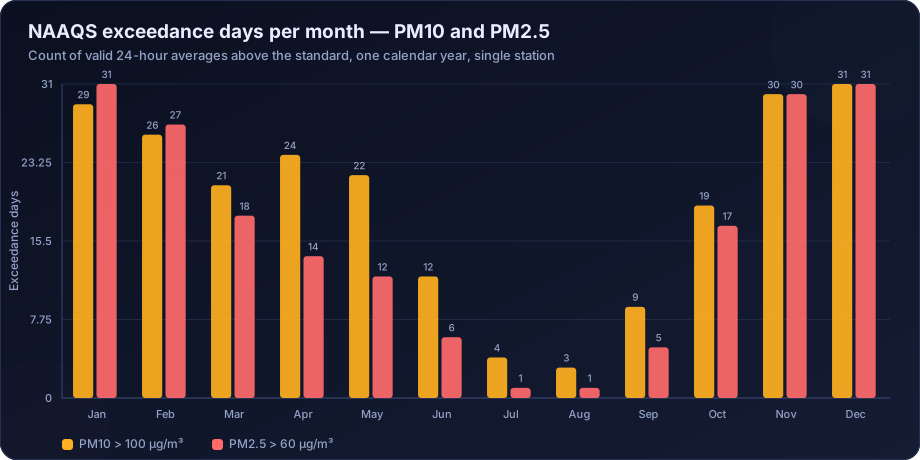
| Exceedance days (> 100 µg/m³) | 121 days | ≤ 2% (≈ 7 days) | FAIL |
| Exceedance percentage | 36.6% | ≤ 2% | FAIL |
| 98th percentile of 24-h values | 258 µg/m³ | 100 µg/m³ | FAIL |
| Longest consecutive exceedance run | 19 days | ≤ 1 day | FAIL |
| Overall | Non-compliant |
Contrast with a marginal case:
| Metric | Value | Standard | Result |
|---|---|---|---|
| Valid days | 348 of 365 | — | 95.3% |
| Annual arithmetic mean | 58 µg/m³ | 60 µg/m³ | PASS |
| Exceedance days | 5 days | ≤ 2% (≈ 7) | PASS on count |
| 98th percentile | 97 µg/m³ | 100 µg/m³ | PASS |
| Consecutive exceedances | 14–15 January, 2 consecutive days | ≤ 1 day | FAIL |
| Overall | Non-compliant |
The second station passes the annual test, passes the exceedance-count test, passes the percentile test — and fails compliance on the consecutive-day rule alone. A report that stopped at the annual mean would have declared it compliant, and would have been wrong.
Data Capture and Its Consequences
| Capture achieved | What can be reported |
|---|---|
| ≥ 75%, well distributed seasonally | Full compliance determination |
| ≥ 75%, seasonally imbalanced | Report with an explicit representativeness caveat; the mean is season-weighted |
| 50–75% | Indicative statistics only; no compliance determination |
| < 50% | Descriptive reporting only |
The seasonal distribution point matters more than practitioners generally acknowledge. A year with 78% capture concentrated outside winter will produce an annual mean well below the true value in most of North India. Arithmetically the dataset passes; analytically it is misleading. State the seasonal capture explicitly.
Compliance in Different Regulatory Contexts
EIA baseline
For an EIA under the EIA Notification 2006, baseline ambient monitoring is typically conducted over one season (usually excluding monsoon) at multiple locations, with prescribed frequency. The comparison against NAAQS establishes existing status; the incremental impact of the project is then predicted by dispersion modelling and added to the baseline for a cumulative assessment.
A one-season baseline cannot support an annual-mean compliance determination, and should never be presented as one. It supports a statement about that season, plus a comparison of measured 24-hour values against the 24-hour standard.
Consent to Establish and Consent to Operate
Consent conditions issued under the Air (Prevention and Control of Pollution) Act framework administered by CPCB and the state boards may specify ambient monitoring at the facility boundary or at defined receptors, with reporting frequency and format set by the SPCB. Consent conditions frequently differ from NAAQS — they may be stricter, may specify different averaging periods, or may name parameters not in NAAQS. Compliance is assessed against the consent condition as written, and the report should present both.
Cumulative and airshed assessment
Where multiple facilities exist, the question shifts from individual compliance to whether the airshed as a whole meets standards. Methods for this are covered in cumulative air quality impact assessment.
Non-attainment cities
Cities that have consistently failed NAAQS are designated non-attainment and come under city action plans, discussed in NCAP city air quality analysis. In these cities, incremental additions face closer scrutiny and the compliance analysis is expected to address cumulative airshed capacity.
Structuring a Compliance Report
A report that withstands scrutiny contains, in order:
- Monitoring programme description — locations with coordinates and land-use classification, parameters, methods, instruments, period and frequency.
- QA/QC statement — calibration record, validation tests applied, flagging summary, and data capture per parameter with seasonal breakdown.
- Summary statistics table — for each parameter and station: valid n, minimum, maximum, arithmetic mean, geometric mean, median, 50th/75th/90th/95th/98th percentiles.
- Compliance table — each test presented separately with the standard, the computed value and the pass/fail result, including the consecutive-day check.
- Exceedance register — every exceedance date, value, and where known the attributable cause.
- Time series and distribution plots — with the standard drawn on the chart.
- Meteorological context — wind roses and a discussion of the conditions during exceedance periods.
- Interpretation — what drove the results, whether the exceedances are episodic or systematic, and what they imply.
- Limitations — data capture, method uncertainty, station representativeness.
Recurring Errors
- Reporting only the annual mean and declaring compliance.
- Counting exceedance days but never checking consecutive days.
- Computing the 98th percentile over calendar days rather than over valid measurements.
- Computing 8-hour ozone as fixed blocks rather than a rolling maximum.
- Comparing a 1-hour maximum against the 24-hour limit, or an annual mean against a 24-hour limit.
- Presenting a one-season baseline as an annual compliance result.
- Omitting the data capture figure, so the reader cannot weight the conclusion.
- Ignoring seasonal imbalance in the valid data.
- Averaging AQI values instead of comparing concentrations, which is invalid and also not the compliance metric.
- Mixing units — CO in mg/m³ against everything else in µg/m³.
- Applying the industrial/residential limit at an ecologically sensitive location, where stricter SO2 and NO2 limits apply.
How DSTechnoverse Helps
DSTechnoverse prepares and reviews ambient air quality compliance reporting for industries, consultancies and monitoring agencies across India.
- Compliance computation — every applicable test computed correctly: annual mean, exceedance count and percentage, 98th percentile with a stated convention, consecutive-day check, and full data capture accounting with seasonal breakdown.
- Validation first — no compliance statistic is produced from unvalidated data, and the validation record is delivered alongside the result.
- Consent condition mapping — compliance assessed against the specific consent conditions as written, presented alongside NAAQS so both positions are clear.
- Exceedance investigation — attribution of exceedance periods to meteorological conditions, regional episodes, local sources or process events, using wind sector analysis and cross-station comparison.
- Report preparation — structured to SPCB, CPCB and EIA appraisal expectations, with methods, statistics, plots, exceedance registers and limitations documented in full.
- Third-party review — audit of existing compliance reporting before submission, where we routinely find missing consecutive-day checks, fixed-block ozone averaging and unstated data capture.
Where results are close to a limit or a project needs predictive assessment, we extend the work into dispersion modelling so that measured baseline and predicted increment are assessed on a consistent basis.
Need air quality data turned into a defensible answer? DSTechnoverse provides end-to-end air quality analysis services — monitoring data validation, statistical analysis, source apportionment, dispersion modelling, GIS mapping, and regulator-ready reporting. Talk to our air quality team about your dataset or project.
Frequently Asked Questions
How is NAAQS compliance determined in India?
Through two independent tests. The annual arithmetic mean must not exceed the annual limit, and the short-term limit must not be exceeded on more than 2% of monitored occasions, and never on two consecutive days. Both tests must be passed, and both require adequate data capture and minimum measurement frequency.
What is the 98th percentile rule?
It is the operational form of the "2% of the time" allowance in the NAAQS. The valid 24-hour values are ranked and the 98th percentile is compared against the short-term limit. If that value is at or below the limit, the short-term test is satisfied on the percentile criterion — but the consecutive-day rule must be checked separately.
Can a station comply on the annual mean but still be non-compliant?
Yes. The annual and short-term tests are independent. A station can have an annual mean below the annual limit while its 98th percentile exceeds the 24-hour limit, or while two exceedances fall on consecutive days. Either failure means the station does not comply.
What is the minimum data required for a NAAQS compliance determination?
For manual monitoring, a minimum of 104 measurements taken twice weekly at uniform intervals. For continuous monitoring, at least 75% valid data across the year, with 18 of 24 valid hours for each daily average, and valid data reasonably distributed across seasons.
Does a one-season EIA baseline establish annual compliance?
No. A single non-monsoon season cannot support an annual-mean determination, and presenting it as one overstates the finding. A seasonal baseline supports a statement about that season and a comparison of measured 24-hour values against the 24-hour standard, nothing more.
What if consent conditions differ from NAAQS?
Compliance is assessed against the consent condition as written, since that is the legally binding obligation on the facility. Consent conditions may be stricter, may use different averaging periods, or may cover parameters not in NAAQS. Good practice is to present both the consent assessment and the NAAQS comparison.
How should exceedances be reported?
As a register listing every exceedance date and value, the total count and percentage, the 98th-percentile value, the longest consecutive run, and where determinable the attributable cause — a regional episode, a local source, an event such as a festival, or a process upset. Counting exceedances without investigating them leaves the most useful information unreported.
Do ecologically sensitive areas have different standards?
Yes. NAAQS specifies stricter limits for ecologically sensitive areas notified by the central government, particularly for SO2 (annual 20 µg/m³ instead of 50) and NO2 (annual 30 µg/m³ instead of 40). Applying the general limits at such a location is a compliance determination error.
Related services
Related articles
- Air Quality Statistics: Means, Percentiles and What Standards Require
- PM2.5 and PM10 Data Analysis: From Raw Monitor Output to Defensible Insight
- Air Quality Analysis: The Complete Guide to Parameters, Methods and Data Interpretation
- Air Quality Forecasting with Machine Learning: Models, Features and Honest Validation