Quick answer: Here is how to calculate AQI in India: take each pollutant's concentration at its correct averaging period (24-hour for PM10, PM2.5, NO2, SO2, NH3 and lead; maximum 8-hour for CO and O3), find the CPCB breakpoint band it falls in, convert it to a sub-index with the linear interpolation formula I = I_LO + [(I_HI − I_LO) / (BP_HI − BP_LO)] × (C − BP_LO), and report the highest sub-index as the AQI. At least three pollutants, including PM2.5 or PM10, are needed for a valid result.
The Air Quality Index is the most visible product of air quality analysis and the least understood. It appears on phones, news tickers and dashboards as a single number, which invites the assumption that it is a simple average of pollution. It is not. It is a piecewise linear transformation of eight separate pollutant concentrations into a common health-risk scale, from which the worst value is selected. Understanding that construction is the difference between reporting AQI correctly and producing numbers that a reviewer can pull apart.
This guide covers India's National AQI, often called the CPCB AQI, in full: the AQI formula, the CPCB breakpoint table, averaging and minimum-data rules, worked examples, a calculator, health advice, US EPA differences, phone apps versus the official bulletin, common mistakes and industrial compliance reporting.
India's National Air Quality Index is calculated by converting each pollutant's concentration into a sub-index using a linear interpolation between CPCB breakpoints, then reporting the highest sub-index as the AQI. Sub-indices are required for a minimum of three pollutants, one of which must be PM2.5 or PM10, and the pollutant producing the highest sub-index is reported as the "prominent pollutant".
What the AQI Is Designed to Do
The AQI exists to solve a communication problem. A citizen cannot be expected to know that 61 µg/m³ of PM2.5 over 24 hours is roughly as concerning as 190 µg/m³ of PM10, or 105 µg/m³ of 8-hour ozone. The index maps each of those onto the same 0 to 500 health scale so they become directly comparable, and attaches plain-language health advice to each band.
India's index was launched in 2015 under the National Air Quality Index initiative, developed by CPCB with IIT Kanpur and an expert group. The official reference and live values are published on the CPCB National Air Quality Index portal. If you want a refresher on what each of the eight pollutants is and where it comes from, see air quality parameters explained.
Three design decisions follow from that purpose and explain everything about how the AQI behaves:
- It is health-scaled, not concentration-scaled. Equal AQI values across pollutants imply roughly equal health concern, not equal mass concentration.
- It takes the maximum, not the average. If any one pollutant is dangerous, the air is dangerous. Averaging would let a clean pollutant mask a hazardous one.
- It is piecewise linear. Real concentration-response relationships are curved; the index approximates them with straight-line segments between anchor points chosen by the expert group.
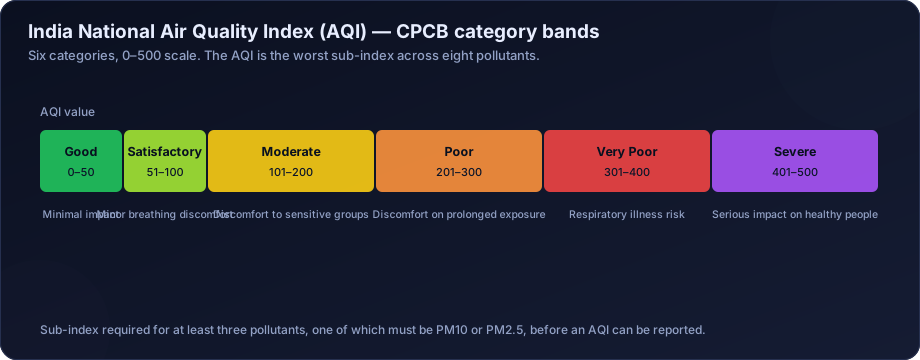
The Six AQI Categories and What They Mean for Health
| AQI range | Category | Colour | Health implications |
|---|---|---|---|
| 0–50 | Good | Green | Minimal impact |
| 51–100 | Satisfactory | Light green | Minor breathing discomfort to sensitive people |
| 101–200 | Moderate | Yellow | Breathing discomfort to people with lung or heart disease, children and older adults |
| 201–300 | Poor | Orange | Breathing discomfort to most people on prolonged exposure |
| 301–400 | Very Poor | Red | Respiratory illness on prolonged exposure |
| 401–500 | Severe | Dark red / maroon | Affects healthy people; serious impact on those with existing disease |
Note the band widths: Good and Satisfactory span 50 points each, the remaining four span 100 points each. This is deliberate and matters when you interpolate.
The statements above follow CPCB's category descriptions. The table below summarises common practical advice; it is not official CPCB text, and people with medical conditions should follow their doctor's advice.
| Category | Typical practical advice |
|---|---|
| Good | No precautions needed |
| Satisfactory | Unusually sensitive people may consider reducing long, heavy outdoor exertion |
| Moderate | People with asthma, heart or lung disease, children and older adults reduce prolonged outdoor exertion |
| Poor | Everyone reduces prolonged or heavy outdoor exertion; sensitive groups avoid it |
| Very Poor | Avoid outdoor exertion; sensitive groups stay indoors where practical |
| Severe | Avoid outdoor activity; keep windows closed; sensitive groups take medical advice |
In Delhi NCR the categories also have a regulatory role. The Graded Response Action Plan (GRAP) ties escalating control measures, such as restrictions on construction and certain vehicles, to forecast and observed AQI stages from Poor upwards.
How to Calculate AQI: The AQI Formula and Sub-Index
For a pollutant with concentration C falling between two breakpoints, the sub-index is:
I = I_LO + [ (I_HI − I_LO) / (BP_HI − BP_LO) ] × (C − BP_LO)
Where:
- C = the pollutant concentration, at the correct averaging period
- BP_LO = the concentration breakpoint at or below C
- BP_HI = the concentration breakpoint at or above C
- I_LO = the AQI value corresponding to BP_LO
- I_HI = the AQI value corresponding to BP_HI
This is simple linear interpolation within a band. The whole subtlety of AQI calculation lies in using the right breakpoint table, the right averaging period, and the right rounding convention.
The Air Quality Index Formula, Step by Step
If you have never applied an interpolation formula before, it helps to break the AQI calculation formula into five plain steps:
- Find the band. Look up the pollutant's column in the breakpoint table and find the row whose concentration range contains C. That row gives you BP_LO, BP_HI, I_LO and I_HI.
- Measure how far into the band C sits. Subtract the lower breakpoint: (C − BP_LO). This is the distance travelled into the band, in concentration units.
- Work out the slope. Divide the width of the index band by the width of the concentration band: (I_HI − I_LO) / (BP_HI − BP_LO). This tells you how many AQI points each unit of concentration is worth inside this band. The slope is different in every band and for every pollutant, which is exactly how the index encodes health weighting.
- Convert distance to index points. Multiply the slope by the distance from step 2.
- Add the starting point. Add I_LO. The result is the sub-index, rounded to a whole number for reporting.
Repeat for every pollutant you have valid data for, then take the maximum. That maximum is the AQI, and the pollutant that produced it is the prominent pollutant.
One practical point on rounding. The CPCB table is written with integer breakpoints for most pollutants (for example 31 to 60 for PM2.5) and one decimal place for CO. A measured 24-hour average such as 30.6 µg/m³ sits in the gap between 30 and 31. The defensible approach is to round the concentration to the precision used in the table before choosing the band, then apply the formula, and to state that convention in your method note. What matters most is that one convention is used consistently across a dataset.
CPCB Breakpoint Tables — All Eight Pollutants
The averaging period differs by pollutant and is not negotiable. Using an hourly value where a 24-hour value is required is the single most common source of wrong AQI figures.
| AQI band | PM10 (24-h, µg/m³) | PM2.5 (24-h, µg/m³) | NO2 (24-h, µg/m³) | O3 (8-h, µg/m³) | CO (8-h, mg/m³) | SO2 (24-h, µg/m³) | NH3 (24-h, µg/m³) | Pb (24-h, µg/m³) |
|---|---|---|---|---|---|---|---|---|
| 0–50 (Good) | 0–50 | 0–30 | 0–40 | 0–50 | 0–1.0 | 0–40 | 0–200 | 0–0.5 |
| 51–100 (Satisfactory) | 51–100 | 31–60 | 41–80 | 51–100 | 1.1–2.0 | 41–80 | 201–400 | 0.6–1.0 |
| 101–200 (Moderate) | 101–250 | 61–90 | 81–180 | 101–168 | 2.1–10 | 81–380 | 401–800 | 1.1–2.0 |
| 201–300 (Poor) | 251–350 | 91–120 | 181–280 | 169–208 | 10.1–17 | 381–800 | 801–1200 | 2.1–3.0 |
| 301–400 (Very Poor) | 351–430 | 121–250 | 281–400 | 209–748 | 17.1–34 | 801–1600 | 1201–1800 | 3.1–3.5 |
| 401–500 (Severe) | 430+ | 250+ | 400+ | 748+ | 34+ | 1600+ | 1800+ | 3.5+ |
Averaging periods: PM10, PM2.5, NO2, SO2, NH3 and Pb use 24-hour averages; O3 and CO use 8-hour rolling maxima.
Reading the AQI Breakpoints
A few features of the AQI breakpoints are worth noticing before you calculate anything:
- The Satisfactory ceiling matches the NAAQS. For most pollutants the top of the Satisfactory band (AQI 100) sits at the 24-hour or 8-hour National Ambient Air Quality Standard: 100 µg/m³ for PM10, 60 for PM2.5, 80 for NO2 and SO2, 100 for 8-hour O3, 2 mg/m³ for 8-hour CO, 400 for NH3 and 1.0 for lead. An AQI above 100 for those pollutants therefore means the relevant short-term standard was exceeded on that day.
- Band slopes vary widely. The PM2.5 Very Poor band covers 121 to 250 µg/m³, much wider than the Poor band of 91 to 120, so each microgram moves the index less once you are in Very Poor. The ozone Very Poor band is wider still.
- CO is in milligrams. Every other column is in micrograms per cubic metre. This is the most common unit trap in the whole calculation.
The NAAQS values themselves, with their annual and short-term averaging periods, are tabulated in our NAAQS India reference.
Averaging Rules: 24-Hour and 8-Hour Values
The breakpoints only mean something when the input concentration is built over the averaging period the table assumes. In practice that means two kinds of input.
24-hour averages (PM10, PM2.5, NO2, SO2, NH3, Pb). For a continuous analyser, take the hourly values for the day and average them.
Maximum 8-hour average (CO, O3). Build a rolling 8-hour mean for each hour of the day, then take the highest. A rolling window starting at every hour finds the worst continuous 8 hours, which for ozone is usually the late morning to late afternoon block. Fixed blocks (00:00 to 08:00, 08:00 to 16:00, 16:00 to 24:00) will often split the peak and understate the sub-index.
| Pollutant | Input to the AQI calculation | Common wrong input |
|---|---|---|
| PM10, PM2.5 | 24-hour mean | Latest hourly value |
| NO2, SO2, NH3 | 24-hour mean | 1-hour peak |
| Pb | 24-hour filter result | Monthly mean |
| CO | Highest rolling 8-hour mean, mg/m³ | Hourly peak, or value in µg/m³ |
| O3 | Highest rolling 8-hour mean | Fixed 8-hour block, or 1-hour peak |
For continuous stations, the hourly series should be validated first, with zero and span drifts, instrument faults and outliers flagged. Our guide to cleaning air quality monitoring data covers the practical steps.
Worked Example 1 — PM2.5 in the Poor Band
A station records a 24-hour PM2.5 average of 112 µg/m³.
- 112 falls in the 91–120 concentration band, which maps to AQI 201–300.
- BP_LO = 91, BP_HI = 120, I_LO = 201, I_HI = 300.
- I = 201 + [(300 − 201) / (120 − 91)] × (112 − 91)
- I = 201 + (99 / 29) × 21
- I = 201 + 3.414 × 21 = 201 + 71.7 = 272.7 → 273
The PM2.5 sub-index is 273, which is in the "Poor" category.
Worked Example 2 — A Complete Station Day
The same station reports the following on the same day:
| Pollutant | Concentration | Averaging period | Sub-index |
|---|---|---|---|
| PM2.5 | 111 µg/m³ | 24-h | 269 |
| PM10 | 212 µg/m³ | 24-h | 175 |
| NO2 | 84 µg/m³ | 24-h | 104 |
| SO2 | 41 µg/m³ | 24-h | 51 |
| CO | 4.6 mg/m³ | 8-h max | 132 |
| O3 | 116 µg/m³ | 8-h max | 123 |
| NH3 | 88 µg/m³ | 24-h | 22 |
| Pb | 0.08 µg/m³ | 24-h | 8 |
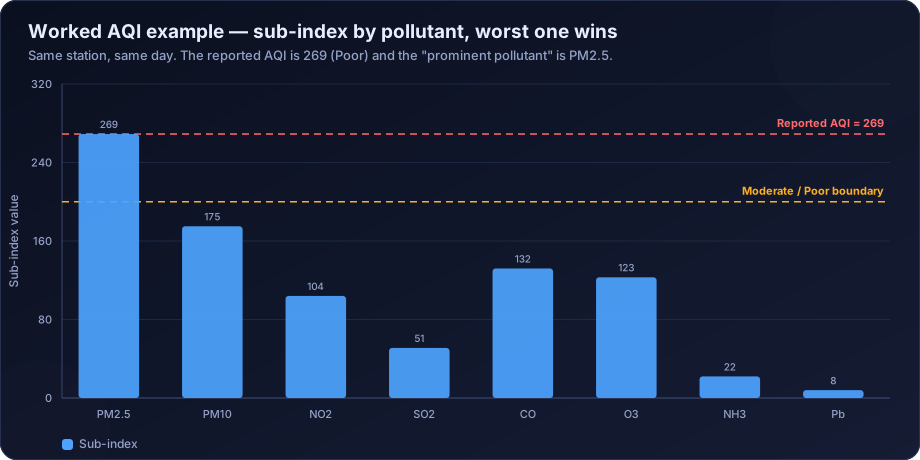
Reported AQI = 269 (Poor). Prominent pollutant = PM2.5.
Notice what the chart makes obvious: seven of eight pollutants are in Good, Satisfactory or Moderate territory. The station's air is classified Poor entirely because of PM2.5. This is the normal situation across most of India, and it is why PM-focused control strategies dominate. The index is telling you exactly where the problem is.
Worked Example 3 — An Ozone-Led Summer Day
The numbers below are illustrative, chosen to show a day when a gas rather than particulate matter sets the AQI. A suburban station downwind of a city records the following on a hot, sunny day:
| Pollutant | Concentration (illustrative) | Averaging period | Band used | Sub-index |
|---|---|---|---|---|
| O3 | 190 µg/m³ | 8-h max | 169–208 → 201–300 | 254 |
| PM10 | 140 µg/m³ | 24-h | 101–250 → 101–200 | 127 |
| PM2.5 | 55 µg/m³ | 24-h | 31–60 → 51–100 | 92 |
| NO2 | 60 µg/m³ | 24-h | 41–80 → 51–100 | 75 |
| CO | 1.4 mg/m³ | 8-h max | 1.1–2.0 → 51–100 | 67 |
The ozone sub-index works through as follows:
- I = 201 + [(300 − 201) / (208 − 169)] × (190 − 169)
- I = 201 + (99 / 39) × 21
- I = 201 + 2.538 × 21 = 201 + 53.3 = 254.3 → 254
And the PM2.5 sub-index, which sits in the Satisfactory band:
- I = 51 + [(100 − 51) / (60 − 31)] × (55 − 31)
- I = 51 + (49 / 29) × 24 = 51 + 40.6 = 91.6 → 92
Reported AQI = 254 (Poor). Prominent pollutant = O3. Five pollutants are available, including both PM fractions, so the minimum-data rule is met. Ozone can dominate on hot, sunny pre-monsoon days, particularly downwind of cities.
A Fourth Case: When No AQI Should Be Reported
Suppose the same station's particulate analysers were down for maintenance and only NO2, CO and O3 were valid. Three pollutants are available, but none is PM2.5 or PM10, so the CPCB rule is not met and no AQI is reported for that station-day.
The Minimum Data Requirement
CPCB's rule is explicit and frequently ignored:
A sub-index must be available for at least three pollutants, of which one must be PM2.5 or PM10. If this condition is not met, no AQI is reported for that station-day.
The logic is straightforward. Computing an AQI from SO2, NO2 and NH3 alone in an Indian city would almost always return "Good" while the actual air was hazardous with particulates. Reporting an AQI without a PM sub-index is therefore not a conservative estimate; it is a misleading one.
A second rule follows from validation practice: a 24-hour average should be built from at least 16 valid hourly values (a 67% capture, with many operators applying the stricter 75% rule), and an 8-hour rolling mean from at least 6 valid hours. Averages computed from fewer values must be flagged. This is covered fully in QA/QC for air quality monitoring data.
| Check | Rule | If it fails |
|---|---|---|
| Pollutants available | At least 3 | No AQI for that station-day |
| Particulate present | PM2.5 or PM10 among them | No AQI for that station-day |
| 24-hour capture | At least 16 valid hours | Drop that pollutant's sub-index, then re-check the two rules above |
| 8-hour capture | At least 6 valid hours in the window | Exclude that window from the 8-hour maximum |
Station AQI Versus City AQI
A station AQI is the maximum sub-index at that station. For city figures, read the method note of the bulletin you are quoting, because publishers combine stations in different ways.
For your own analysis, remember that the AQI is a non-linear transformation of concentration: the mean of transformed values is not the transform of the mean. A city with stations at AQI 400 and AQI 100 does not have "AQI 250" in any physically meaningful sense. The analytically sound route for any aggregate you build yourself, across stations or across days, is to average concentrations per pollutant first, then compute sub-indices and take the maximum, and to say clearly which method you used.
AQI India Versus US EPA AQI
| Aspect | India (CPCB) | United States (EPA) |
|---|---|---|
| Scale | 0–500 | 0–500 |
| Categories | 6 | 6 |
| Pollutants | 8 (adds NH3, Pb) | 6 |
| PM2.5 24-h "Good" ceiling | 30 µg/m³ | 9.0 µg/m³ (2024 revision) |
| PM2.5 breakpoint at AQI 100 | 60 µg/m³ | 35.4 µg/m³ |
| Category names | Good … Severe | Good … Hazardous |
| Aggregation | Max sub-index | Max sub-index |
Both indices use the same maximum-of-sub-indices logic; the breakpoints differ. This is why an Indian city reporting AQI 150 would report a considerably higher number on the US scale, and why comparing AQI values across countries without stating the scale is meaningless. The US methodology is documented at AirNow AQI basics.
Several other differences matter when you compare numbers:
- Units for gases. The US index expresses gases in parts per billion or parts per million, while India uses mass concentrations (µg/m³, and mg/m³ for CO). Converting requires temperature and pressure assumptions.
- Averaging periods. The US index uses a 1-hour basis for SO2 and NO2 and allows a 1-hour ozone basis at higher levels, whereas India uses 24-hour SO2 and NO2 and only the 8-hour ozone maximum.
- Category names and meaning. The US scale names its second band "Moderate" and its third "Unhealthy for Sensitive Groups". India's "Moderate" is its third band. A US "Moderate" day and an Indian "Moderate" day are not the same thing.
- Hourly reporting. The US publishes current conditions using a weighted recent-hours method for particulate matter, while India's official index is anchored to 24-hour averages.
Hourly AQI Apps Versus the Official Daily AQI
Many people first meet the AQI on a weather app or a third-party map, and the number often disagrees with the CPCB figure for the same city on the same day. That is rarely because one of them is wrong. It is usually because they are answering different questions.
| Source | What it usually shows | Why it may differ from the official figure |
|---|---|---|
| CPCB daily bulletin | Station and city AQI for a 24-hour period ending in the afternoon | It is the reference value for official purposes |
| CPCB live portal and app | AQI updated hourly from the latest rolling averages | A rolling 24-hour value changes every hour and will not equal the bulletin value |
| International apps and maps | Often the US EPA scale, sometimes on a near-real-time basis | Different breakpoints and categories; numbers usually higher for the same PM2.5 |
| Low-cost sensor networks | Values from optical sensors, often uncalibrated | Humidity and calibration errors; see low-cost sensor calibration |
| Building or campus displays | Instantaneous or hourly readings labelled "AQI" | Applying 24-hour breakpoints to 1-hour data inflates the index |
Before comparing two AQI numbers, establish the scale, the averaging period and the station.
Common AQI Calculation Mistakes
- Using hourly PM2.5 to compute AQI. The PM breakpoints are defined for 24-hour averages. Feeding an hourly spike into them produces a dramatically inflated index.
- Using an 8-hour block average instead of the rolling 8-hour maximum for ozone and CO. The rolling maximum is almost always higher.
- Averaging AQI values across stations or across time. Not equivalent to the index of the average because of the non-linear transform. Average the concentrations, then compute the index.
- Reporting an AQI without a PM sub-index. Violates the CPCB minimum-data rule and understates risk.
- Ignoring the data-capture requirement, so a 24-hour average built from four hours becomes a published index.
- Mixing units. CO breakpoints are in mg/m³, everything else in µg/m³. A factor-of-1000 error here is common and catastrophic.
- Interpolating across a band boundary by using the wrong BP_LO/BP_HI pair. The value must sit inside the band whose breakpoints you use.
- Confusing AQI with concentration in narrative text, for example "PM2.5 was 269" when 269 was the index, not micrograms.
- Using US breakpoints in an Indian report, often because a software library or online calculator defaulted to the US EPA table.
- Mixing ppb and µg/m³ for gases when data come from analysers configured in volumetric units, without a documented conversion.
- Using unvalidated raw feeds, so a stuck analyser or a calibration span is treated as real air.
Implementing AQI Calculation in Code
For any operational use, the calculation should be scripted rather than done in a spreadsheet, so the breakpoint tables live in one place and the averaging rules are enforced. A minimal implementation needs four components:
- A breakpoint lookup table per pollutant, held as data rather than buried in formulas, with units stated.
- An averaging routine that builds 24-hour means and rolling 8-hour maxima and enforces the data-capture rule.
- The interpolation function, with a single, documented rounding convention.
- An aggregation step that applies the three-pollutant and PM rules, picks the maximum and records the prominent pollutant.
Test it against hand-calculated cases like the worked examples above. Our guide to statistical analysis of air quality data in R and Python includes a working implementation, and the pandas workflow for air quality data shows how to build the rolling averages.
AQI Calculation for Industry Compliance Reporting
What AQI is not. Legal compliance in India is judged against NAAQS concentrations with their averaging periods and the 98th-percentile rule for 24-hour values, not against AQI categories. An Environmental Clearance six-monthly compliance report or a consent renewal should present concentrations, data capture and exceedance statistics, as set out in our guide to compliance reporting against NAAQS.
Where AQI is useful. It is a sensible way to summarise monitoring for non-specialists: a plant's community liaison, a public display at the gate, or a management dashboard. If a consent condition, an SPCB communication or a corporate policy asks for an AQI, compute it exactly as CPCB does, from validated data, and present it alongside the concentration tables rather than instead of them.
Good practice for an industrial AQI summary:
- Validate the hourly CAAQMS data first; see CAAQMS data analysis in India.
- Build 24-hour and 8-hour values with the capture rules applied.
- Compute daily AQI only on days that meet the minimum-data rule, and report the count of valid days.
- Report the distribution of days by category and the prominent pollutant on each day.
- Present NAAQS compliance separately, using concentrations and percentiles.
- State the breakpoint table version, averaging rules and rounding convention in a method note.
A fenceline AQI also needs context. Regional background often drives the index, especially for PM2.5 in winter, so a Poor day at the boundary does not by itself show that the facility caused it. Separating local contribution from regional load is a job for wind-sector analysis, source apportionment or dispersion modelling, not for the AQI.
How the AQI Fits Into Broader Analysis
The AQI is a communication instrument, not an analytical one. It is excellent for public advisories and daily reporting, and poor for almost everything else:
- It discards information. Seven sub-indices are computed and thrown away.
- It is non-linear, so it cannot be averaged, trended, or regressed without distortion.
- It is not a compliance metric. Legal compliance in India is determined against NAAQS concentrations with their percentile rules, not against AQI bands.
For trend work use concentrations and proper trend tests. For summary statistics use means and percentiles. For city programmes use NCAP-style analysis. For health questions use a proper health risk assessment. Use the AQI when the audience is the public.
How DSTechnoverse Helps
DSTechnoverse builds and checks AQI calculation for monitoring networks, dashboards, municipal reporting and industrial fenceline systems across India, working remotely from your data. We script the CPCB methodology with the breakpoint tables, 24-hour and 8-hour averaging, capture rules and minimum-data checks enforced, in Python or R, and integrate it with your data pipeline. We also review existing AQI reporting for averaging, unit and aggregation errors, validate the underlying monitoring data, and prepare NAAQS compliance statistics alongside the index. See our air quality analysis service and statistical and research data analysis, or contact us to discuss your dataset.
Frequently Asked Questions
What is the formula for calculating AQI in India?
The sub-index formula is I = I_LO + [(I_HI − I_LO) / (BP_HI − BP_LO)] × (C − BP_LO), where C is the pollutant concentration, BP_LO and BP_HI are the CPCB concentration breakpoints bracketing C, and I_LO and I_HI are the corresponding index values. The reported AQI is the maximum sub-index across all measured pollutants.
How many pollutants are needed to calculate AQI?
At least three, and one of them must be PM2.5 or PM10. If that condition is not met, CPCB methodology requires that no AQI be reported for that station and period, because an index without a particulate sub-index would seriously understate risk in Indian conditions.
Why is AQI the maximum rather than the average of sub-indices?
Because the index communicates health risk. If any single pollutant reaches a hazardous concentration, the air is hazardous regardless of how clean the others are. Averaging would allow low sub-indices to mask a dangerous pollutant, defeating the purpose of the index.
What averaging period is used for each pollutant in AQI?
PM10, PM2.5, NO2, SO2, NH3 and lead use 24-hour averages. Ozone and carbon monoxide use the maximum 8-hour rolling average of the day. Using the wrong averaging period is the most common cause of incorrect AQI values.
Can AQI values be averaged over a month or across stations?
Not without distortion. The AQI is a non-linear transformation of concentration, so the average of AQI values is not the AQI of the average concentration. For your own monthly or multi-station figures, average the concentrations first for each pollutant, then compute sub-indices and take the maximum, and state the method used.
Is Indian AQI the same as US AQI?
The methodology is the same, the maximum of pollutant sub-indices on a 0 to 500 scale, but the breakpoints differ substantially, and India includes ammonia and lead. The same PM2.5 concentration produces a much higher index on the US scale, so AQI values from different countries are not directly comparable.
Why does my phone app show a different AQI from CPCB?
Most apps either use the US EPA scale, show a near-real-time value built from recent hours, or draw on low-cost sensors. The official CPCB index uses Indian breakpoints and 24-hour or 8-hour averages from reference stations. Different scale, averaging period or station will produce a different number for the same air.
What is the "prominent pollutant" in an AQI report?
It is the pollutant whose sub-index is highest, and therefore the one that determined the reported AQI. Identifying it is analytically valuable because it points directly at what needs to be controlled. Across most Indian stations the prominent pollutant is PM2.5 or PM10, though ozone can lead on hot, sunny days.
Does AQI determine legal compliance?
No. Compliance in India is assessed against NAAQS concentration limits with their specific averaging periods and 98th-percentile rules. The AQI is a public communication tool derived from the same measurements, but it has no independent legal standing in consent or clearance determinations.
Can I calculate AQI from a single hourly reading?
Not on the CPCB method. The breakpoints are defined for 24-hour averages for most pollutants and the maximum 8-hour average for CO and ozone. Applying them to a single hourly value usually exaggerates the index during peaks. For live displays, use a rolling average and label it clearly.
Sources and Further Reading
Official and primary sources for the standards, rules and data discussed on this page.
- WHO Global Air Quality Guidelines (2021): health-based guideline values for PM2.5, PM10, NO2, SO2, O3 and CO.
- CPCB: National Air Quality Index portal: live AQI and continuous monitoring station data across India.
- U.S. EPA: 2024 Appendix W final rule: the latest revision of the Guideline on Air Quality Models.
- U.S. EPA: AERMET, AERMAP and other preprocessors: meteorological and terrain preprocessors used with AERMOD.
Related services
Related articles
- Air Quality Statistics: Means, Percentiles and What Standards Require
- Air Quality Analysis: The Complete Guide to Air Quality Data Analysis, Methods and Services
- Air Quality Compliance Reporting Against NAAQS: Percentiles, Exceedances and Defensible Statistics
- Air Quality Forecasting with Machine Learning: Models, Features and Honest Validation