Volatile organic compounds are the most under-measured pollutant family in Indian air quality practice. Only benzene is in the NAAQS, so most monitoring programmes stop there — and in doing so miss the compounds that drive ozone formation, cause the odour complaints that generate regulatory attention, dominate carcinogenic risk near petrochemical and solvent-using facilities, and reveal industrial sources with a specificity no other measurement provides.
This guide covers VOC analysis end to end: what VOCs are, how they are sampled and analysed, how to interpret the resulting speciation, the diagnostic ratios that identify sources, ozone formation potential, health risk screening, and the design of a fenceline monitoring programme that actually answers the question it was set up to answer.
VOC analysis in ambient air is the sampling, laboratory speciation and interpretation of volatile organic compounds — including BTEX aromatics, alkanes, alkenes, halogenated species and carbonyls — using whole-air canister or sorbent-tube collection followed by gas chromatography with mass spectrometric or flame ionisation detection, to quantify individual compounds for health risk assessment, ozone formation potential, odour investigation and industrial source identification.
What VOCs Are and Why They Matter
Volatile organic compounds are carbon-based compounds with sufficient vapour pressure to exist as gases at ambient temperature. The family runs to hundreds of measurable species. They matter through four distinct pathways:
Direct toxicity. Benzene is classified as a Group 1 human carcinogen by the International Agency for Research on Cancer, with no established safe threshold. 1,3-butadiene, formaldehyde and vinyl chloride are similarly classified. These drive cancer risk near industrial and traffic sources.
Ozone formation. VOCs react with NOx under sunlight to produce ground-level ozone. Because reactivity varies by orders of magnitude between species, total VOC mass is a poor predictor of ozone impact — speciation is essential.
Secondary organic aerosol. Oxidation products of aromatics and terpenes condense to form a substantial fraction of PM2.5 organic mass, linking VOC control to particulate control.
Odour. Many VOCs have odour thresholds far below health-based limits. Mercaptans, aldehydes and some aromatics generate complaints at concentrations that are analytically challenging to measure.
The Compounds Worth Measuring
| Group | Species | Principal sources |
|---|---|---|
| BTEX aromatics | Benzene, toluene, ethylbenzene, o/m/p-xylene | Vehicle exhaust and evaporation, petrol stations, solvents, petrochemicals |
| Other aromatics | Styrene, trimethylbenzenes, naphthalene | Plastics, solvents, refining |
| Alkanes | Propane, butane, pentane, hexane | LPG, natural gas, fuel evaporation |
| Alkenes | Ethylene, propylene, 1,3-butadiene, isoprene | Combustion, petrochemical, biogenic (isoprene) |
| Halogenated | Dichloromethane, trichloroethylene, perchloroethylene, vinyl chloride | Degreasing, dry cleaning, PVC manufacture |
| Oxygenated | Formaldehyde, acetaldehyde, acetone, MEK, alcohols | Combustion, secondary formation, solvents, coatings |
| Terpenes | Alpha-pinene, limonene | Vegetation, cleaning products |
| Sulphur compounds | Hydrogen sulphide, methyl mercaptan, dimethyl sulphide | Refineries, pulp and paper, wastewater, landfill |
Which of these to measure is determined by the question. A traffic exposure study needs BTEX and 1,3-butadiene; a refinery fenceline needs the full TO-15 suite plus sulphur species; an odour complaint investigation needs sulphur compounds and aldehydes with very low detection limits; an ozone study needs the full photochemical precursor suite.
Sampling Methods
Whole-air canister sampling
An evacuated, internally passivated stainless-steel canister (SUMMA or silonite) is opened to fill with ambient air, either instantaneously (grab) or over a defined period through a flow restrictor (typically 8 or 24 hours).
Advantages: collects the whole air sample so multiple analyses can be run from one canister; excellent stability for most non-polar compounds; no breakthrough risk; well-established under EPA Method TO-15.
Limitations: expensive canisters requiring rigorous cleaning and certification between uses; poor recovery of polar and reactive compounds; bulky; humidity can affect stability of some species.
Sorbent tube sampling
Air is drawn through a tube packed with adsorbent — Tenax, carbon molecular sieve, or a multi-bed combination — and the tube is thermally desorbed in the laboratory.
Advantages: compact and inexpensive; large sample volumes give very low detection limits; sorbent selection can be tailored to the target compounds; suitable for personal and long-duration sampling.
Limitations: breakthrough risk if sample volume is too large for the compound and sorbent; requires a calibrated pump; the sorbent choice constrains which compounds are captured; thermal desorption is destructive so re-analysis is impossible.
Passive (diffusive) samplers
Badge or tube samplers relying on molecular diffusion, with no pump. Very low cost, so they enable dense spatial networks — which is why they are the backbone of land-use regression studies. They give time-weighted averages over days to weeks, with lower precision than active methods.
DNPH cartridges for carbonyls
Aldehydes and ketones are unstable in canisters and are collected on 2,4-dinitrophenylhydrazine-coated cartridges, forming stable derivatives analysed by HPLC under EPA Method TO-11A. Formaldehyde and acetaldehyde require this route.
Online instrumentation
Automated GC systems with FID or MS detection, running hourly cycles, are deployed at some CAAQMS sites for benzene and BTX. Proton transfer reaction mass spectrometry (PTR-MS) gives sub-minute time resolution for a wide range of species and is a research-grade instrument. Open-path FTIR and UV-DOAS measure path-averaged concentrations across a fenceline, which is the right geometry for detecting fugitive releases.
| Method | Time resolution | Detection limit | Cost | Best use |
|---|---|---|---|---|
| Canister + GC-MS | Grab to 24 h | Sub-ppbv | High per sample | Regulatory, comprehensive speciation |
| Sorbent + TD-GC-MS | Minutes to hours | Sub-pptv possible | Moderate | Low-level and targeted work |
| Passive sampler | Days to weeks | Low ppbv | Very low | Spatial networks, LUR |
| DNPH + HPLC | Hours | Sub-ppbv | Moderate | Carbonyls only |
| Online GC | Hourly | Low ppbv | High capital | Continuous benzene compliance |
| PTR-MS | Seconds | pptv | Very high | Research, plume mapping |
| Open-path FTIR/DOAS | Continuous | Compound-dependent | High capital | Fenceline leak detection |
Laboratory Analysis
Gas chromatography separates the mixture on a capillary column. Detection is by:
- Mass spectrometry (MS) — identifies compounds by mass spectrum, giving high confidence and the ability to detect unexpected species. The default for ambient speciation.
- Flame ionisation detection (FID) — responds to carbon mass, robust and linear over a wide range, but identifies only by retention time. Common for hydrocarbon suites.
- Sulphur chemiluminescence (SCD) or pulsed flame photometric detection for sulphur species.
Quality control that must be present in any credible VOC dataset:
- Multi-point calibration with certified standards spanning the expected range
- Internal standards added to every sample to correct for injection and recovery variation
- Field blanks, trip blanks and laboratory blanks
- Duplicate samples at a defined frequency
- Documented method detection limits per compound
- Canister certification records and sorbent tube blank records
- Holding time compliance — samples analysed within the validated window
A VOC report without stated detection limits per compound and blank results is not interpretable, because much of the interest lies at concentrations close to the limit.
Interpreting the Speciation
Diagnostic ratios
Ratios between compounds identify sources and estimate photochemical age. This is where VOC data earns its cost.
| Ratio | Value | Interpretation |
|---|---|---|
| Toluene / benzene (T/B) | 1.5–3 | Vehicle exhaust dominated |
| Toluene / benzene | > 5–10 | Solvent use, industrial evaporative sources |
| Toluene / benzene | < 1 | Biomass or coal combustion |
| Xylenes / ethylbenzene (X/E) | High (> 3.5) | Fresh emissions, close to source |
| Xylenes / ethylbenzene | Low (< 2) | Photochemically aged airmass |
| Benzene / CO | Elevated | Combustion-derived benzene |
| i-pentane / n-pentane | ~2–3 | Petrol evaporation signature |
| Isoprene present in daytime | — | Biogenic contribution |
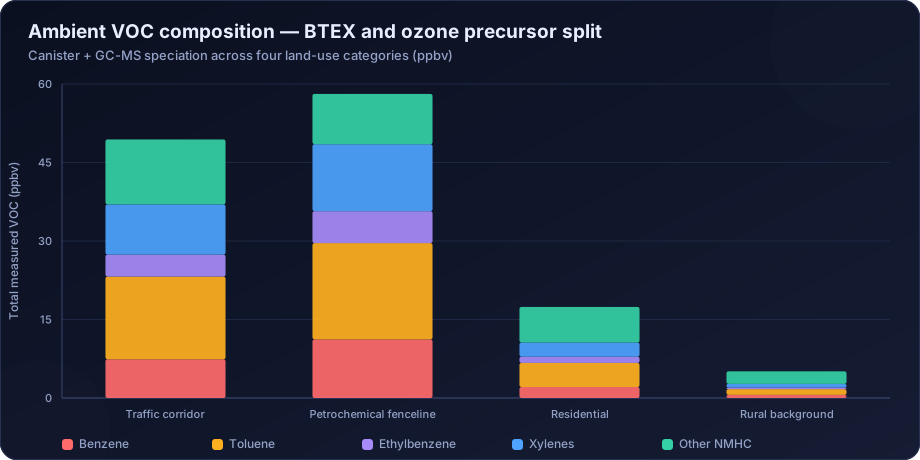
The T/B ratio is the most useful single diagnostic. In the illustrative data above, the traffic corridor shows T/B of about 2.1 — a clean vehicular signature — while the petrochemical fenceline shows 1.6 with much higher absolute benzene, indicating a benzene-rich industrial source rather than a traffic source. Those are different problems requiring different responses, and the ratio distinguishes them immediately.
The X/E ratio works as a photochemical clock because xylenes react with OH radicals considerably faster than ethylbenzene. A falling ratio downwind indicates airmass age, which helps establish whether a measured concentration came from a nearby source or arrived from a distance.
Ozone formation potential
Because reactivity varies enormously between species, VOC control strategy must be reactivity-weighted:
OFP = Σ (concentration of species i × MIR of species i)
where MIR is the Maximum Incremental Reactivity — grams of ozone formed per gram of VOC. Xylenes and trimethylbenzenes have high MIR values; ethane and acetone are near-inert.
The practical consequence is that a facility emitting 100 kg/day of xylenes may have a larger ozone impact than one emitting 500 kg/day of ethane. Ranking sources by mass emission alone misdirects control effort; ranking by OFP directs it correctly.
Health risk screening
For carcinogens, lifetime cancer risk is estimated as:
Risk = Concentration × Inhalation Unit Risk
with the Inhalation Unit Risk taken from an authoritative toxicological database. For non-carcinogens, a hazard quotient compares measured concentration against a reference concentration, and quotients are summed across compounds affecting the same target organ to give a hazard index.
Benzene almost always dominates cancer risk in ambient VOC datasets, which is why it is the one compound in the NAAQS. This links directly to air quality health risk assessment.
Source apportionment
VOC speciation data can be run through PMF in exactly the same way as PM speciation data, resolving factors for vehicle exhaust, fuel evaporation, solvent use, industrial emissions and biogenic sources. Combining VOC and PM speciation in a single PMF run is powerful where both datasets exist — see source apportionment of particulate matter.
Fenceline Monitoring Programme Design
For refineries, petrochemical plants, chemical manufacturing and waste facilities, fenceline VOC monitoring is increasingly expected and sometimes mandated.
- Define the objective — regulatory compliance, leak detection, community assurance, or dispute resolution. These imply different designs.
- Characterise the wind field first. Sampler placement must cover the prevailing downwind sectors, with at least one upwind location to establish background. Without an upwind reference, no attribution claim can be made. See meteorological data for air modelling.
- Select compounds from the site's actual inventory — process streams, storage tanks, wastewater treatment, flares, loading operations.
- Choose the method — passive samplers for spatially dense two-week averages; canisters for detailed speciation of events; open-path for continuous leak detection; online GC for continuous benzene.
- Establish background before any operational conclusion is drawn.
- Define action levels and the response each triggers, agreed in advance.
- Integrate with dispersion modelling so measured concentrations can be attributed to specific units within the site.
- Plan community communication, because fenceline data becomes public and is read by people who did not commission it.
How DSTechnoverse Helps
DSTechnoverse designs and analyses VOC monitoring programmes for industrial facilities, urban air quality studies, EIA baselines and odour investigations.
- Programme design — compound selection matched to the site inventory and the study objective, method selection across canister, sorbent, passive and continuous approaches, sampling location design informed by wind field analysis, and a sampling schedule that captures the conditions of interest.
- Laboratory specification and oversight — method selection under TO-15 and TO-11A, QC requirements including blanks, duplicates, internal standards and documented detection limits, with review of the resulting data package before it is used.
- Interpretation — diagnostic ratio analysis, photochemical age estimation, ozone formation potential ranking, PMF source apportionment on VOC data, and health risk screening for carcinogenic and non-carcinogenic endpoints.
- Fenceline programmes — upwind and downwind design, background establishment, action levels, event investigation and integration with dispersion modelling for unit-level attribution.
- Reporting — results presented against applicable standards and screening values, with detection limits, uncertainty and limitations stated, structured for regulatory submission or community disclosure.
Where VOC results indicate an identifiable source, we follow through with dispersion modelling to quantify impact and test control options rather than leaving the finding as an observation.
Need air quality data turned into a defensible answer? DSTechnoverse provides end-to-end air quality analysis services — monitoring data validation, statistical analysis, source apportionment, dispersion modelling, GIS mapping, and regulator-ready reporting. Talk to our air quality team about your dataset or project.
Frequently Asked Questions
What are VOCs and why are they measured?
Volatile organic compounds are carbon-based compounds that exist as gases at ambient temperature. They are measured because several are directly toxic — benzene is a recognised human carcinogen — because they react with NOx to form ozone, because they contribute to secondary organic aerosol in PM2.5, and because many cause odour complaints at very low concentrations.
What is BTEX?
BTEX refers to benzene, toluene, ethylbenzene and the xylene isomers, the four aromatic compound groups most commonly measured in ambient air. They are associated with vehicle exhaust and evaporation, petrol stations, solvent use and petrochemical operations, and their relative proportions are diagnostic of the source type.
How are VOCs sampled in ambient air?
Principally by evacuated stainless-steel canisters for whole-air collection, sorbent tubes with thermal desorption for lower detection limits, passive diffusive samplers for low-cost spatial networks, and DNPH cartridges for carbonyls such as formaldehyde. Continuous options include online GC systems and open-path optical instruments for fenceline monitoring.
What does the toluene to benzene ratio indicate?
A ratio around 1.5 to 3 indicates vehicle exhaust dominance. Values above about 5 to 10 point to solvent use or industrial evaporative sources. Values below 1 suggest biomass or coal combustion. It is the single most useful diagnostic ratio in ambient VOC interpretation.
What is ozone formation potential?
It is a reactivity-weighted measure of a VOC mixture's capacity to produce ozone, calculated by multiplying each species concentration by its maximum incremental reactivity and summing. It matters because reactivity varies by orders of magnitude between species, so ranking sources by total VOC mass misdirects control effort.
Is benzene regulated in India?
Yes. Benzene is one of the twelve parameters in the National Ambient Air Quality Standards, with an annual limit of 5 µg/m³. The other VOCs are not individually regulated in ambient air, though workplace exposure limits and source emission standards apply in specific contexts.
What is fenceline VOC monitoring?
Monitoring at the perimeter of an industrial facility to detect fugitive emissions and characterise off-site impact. Effective designs place samplers in the prevailing downwind sectors with at least one upwind location to establish background, and agree action levels and response protocols in advance of deployment.
Can low-cost sensors measure VOCs?
Photoionisation detector sensors report a total VOC value, which is useful as a screening indicator for identifying when and where to take a real sample. They cannot identify individual compounds, and since health and ozone significance depend entirely on which compounds are present, a TVOC reading should trigger speciated sampling rather than a conclusion.
Related services
Related articles
- Air Quality Analysis: The Complete Guide to Parameters, Methods and Data Interpretation
- Air Quality Compliance Reporting Against NAAQS: Percentiles, Exceedances and Defensible Statistics
- Air Quality Forecasting with Machine Learning: Models, Features and Honest Validation
- Air Quality GIS Mapping: Spatial Interpolation, Kriging and Exposure Surfaces