India now operates one of the largest real-time air quality monitoring networks in the world. Hundreds of Continuous Ambient Air Quality Monitoring Stations stream hourly concentrations of PM2.5, PM10, SO2, NO2, CO, O3, NH3 and a full meteorological suite to state and central servers, and much of it is publicly accessible. That data is a genuine asset. It is also raw, uneven, and full of traps for anyone who downloads a year of hourly records and immediately computes an average.
This guide covers CAAQMS data end to end: how the stations work, how the data reaches you, what its specific failure modes are, how to validate and aggregate it correctly, and what analysis it can and cannot support.
CAAQMS data analysis is the process of acquiring, validating, aggregating and interpreting hourly measurements from India's Continuous Ambient Air Quality Monitoring Station network. Because continuous analysers produce roughly 8,760 records per parameter per year with automatic calibration cycles, drift, and equipment downtime embedded in the stream, meaningful analysis depends on applying instrument-aware validation and the correct data-capture rules before any statistic is computed.
What a CAAQMS Station Actually Is
A CAAQMS is an air-conditioned cabin containing a set of continuous analysers, a data acquisition system, a calibration gas manifold and a meteorological mast. Each analyser measures one parameter by a designated principle:
| Parameter | Measurement principle | Typical resolution |
|---|---|---|
| PM2.5 / PM10 | Beta attenuation (BAM) or TEOM-FDMS | 1 hour |
| SO2 | Pulsed UV fluorescence | 1 minute to 1 hour |
| NO / NO2 / NOx | Chemiluminescence with molybdenum converter | 1 minute to 1 hour |
| CO | Non-dispersive infrared (NDIR) with GFC | 1 minute to 1 hour |
| O3 | UV photometric absorption | 1 minute to 1 hour |
| NH3 | Chemiluminescence with NH3 converter | 1 hour |
| Benzene / BTX | Online GC with PID or FID | 1 hour |
| Meteorology | Ultrasonic or cup-and-vane anemometer, PT100, capacitive RH | 1 hour |
The data acquisition system averages sub-hourly readings into hourly values, applies status flags, and transmits to the state pollution control board and to CPCB. Public values appear on the CPCB CCR dashboard.
The crucial architectural point: the public feed is a near-real-time operational stream, not a validated dataset. Values appear within the hour, long before any human has reviewed them. Treating downloaded CAAQMS data as validated is the foundational error in most amateur analyses of it.
Getting the Data
Three routes, with different characteristics:
The CPCB CCR portal allows selection of station, parameter and date range, and export of raw or averaged data. It is the standard route for most users. Practical constraints: export windows are limited, so a full year usually requires several requests; the parameter list varies by station; and the raw export includes records that failed validation.
State pollution control board portals sometimes carry additional stations or longer archives for their own network, and occasionally publish validated rather than raw series.
Direct data-sharing arrangements with the operating agency, which is the route for anyone needing sub-hourly data, instrument status flags, or calibration logs. This is worth pursuing for serious work — the status flag column alone transforms what validation is possible.
Whichever route, the first step on receipt is to archive the raw download unmodified and work on a copy.
Structuring the Data
A year of hourly data for eight pollutants plus eight meteorological parameters is 140,000 values per station. Get the structure right before anything else.
- Use a long (tidy) format — one row per station-parameter-timestamp — rather than a wide spreadsheet. Every downstream tool handles it better.
- Parse timestamps into a proper datetime type, and record the timezone explicitly as IST. Mixed date formats in exports (DD/MM/YYYY versus MM/DD/YYYY) are a real and destructive problem.
- Check for duplicate timestamps, which appear after transmission retries.
- Check for missing timestamps — a gap in the file is not the same as a null value in the file, and only one of them is visible if you count rows.
- Standardise units at import. CO is reported in mg/m³ while others are in µg/m³; some exports switch.
- Preserve every flag or status column rather than dropping it to make the file tidy.
Validation Problems Specific to Continuous Analysers
Generic QA/QC applies (see QA/QC for air quality monitoring data), but continuous instruments produce characteristic artefacts that an analyst should be able to recognise on sight.
Automatic calibration cycles
Most analysers run an automatic zero and span check daily, typically in the early hours. During the cycle the analyser is sampling calibration gas, not ambient air. If the flag column is not honoured, those values enter the dataset.
Signature: an implausibly regular pattern — a sharp identical value or a square-wave step appearing at the same clock hour every day. Any concentration series with a perfectly periodic daily artefact is showing you the calibration cycle.
Zero drift
Baseline drift between calibrations means an analyser can silently add or subtract a constant from every reading for weeks. It is invisible in the concentration series and obvious in a plot of daily zero-check results over time.
Negative values
Continuous analysers legitimately report small negative values when true concentration is near zero and the baseline noise is symmetric. Small negatives should be retained (or substituted at half the detection limit) with a flag, because deleting them biases the mean upward. Large negatives are faults.
NOx converter efficiency
Chemiluminescence NOx analysers measure NO directly and NO2 by difference after converting NO2 to NO in a heated molybdenum converter. As the converter ages its efficiency falls, and NO2 is under-reported while NO reads correctly. The check is the converter efficiency test; the data signature is a slowly declining NO2/NOx ratio with no atmospheric explanation.
Ozone and NO interference
Near a strong NO source, ambient ozone is titrated to near zero. A city-centre station reporting very low ozone next to a suburban station reporting high ozone is usually showing real chemistry, not an instrument fault — but the two must not be pooled into a single "city ozone" figure.
PM analyser artefacts
BAM instruments can under-read semi-volatile nitrate in warm conditions and are sensitive to filter tape advance faults. TEOM without FDMS loses semi-volatiles systematically. Both are worth knowing when comparing CAAQMS PM against gravimetric reference data from the same site.
Meteorological sensor stalls
Cup anemometers and wind vanes have a starting threshold below which they report zero speed and a frozen direction. A wind rose built from stalled-sensor data is an artefact. Check for repeated identical direction values at low speeds.
Aggregation Rules
Hourly data must be aggregated correctly before comparison with any standard. The rules differ by parameter, and getting them wrong is the most common analytical error with CAAQMS data.
| Statistic | Rule | Minimum valid records |
|---|---|---|
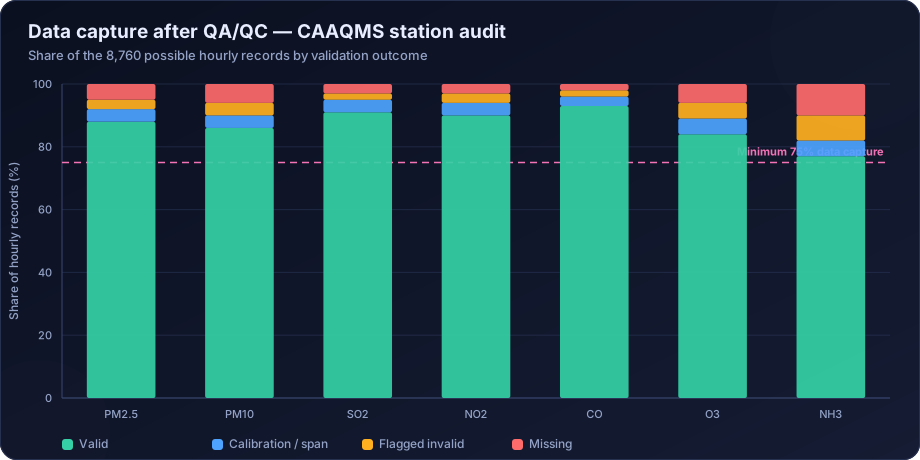
| 24-hour average (PM10, PM2.5, SO2, NO2, NH3) | Calendar day mean, midnight to midnight IST | 18 of 24 hours (75%) |
| 8-hour maximum (O3, CO) | Maximum of all rolling 8-hour means in the day | 6 of 8 hours per window |
| Monthly mean | Mean of valid daily values | 75% of days |
| Annual mean | Mean of valid daily values across the year | 75% of days, reasonably distributed across seasons |
| 98th percentile | Rank valid 24-hour values, take the 98th percentile | Full year with adequate capture |
Two specifics worth emphasising. The 8-hour maximum is a rolling maximum, not the mean of three fixed 8-hour blocks — you compute every 8-hour window in the day and take the largest. And calendar days must run midnight to midnight in IST, not in UTC, which is a genuine hazard when analysis is done in tools that default to UTC.
What Continuous Data Makes Possible
The value of hourly resolution is that it supports analysis that daily data cannot.
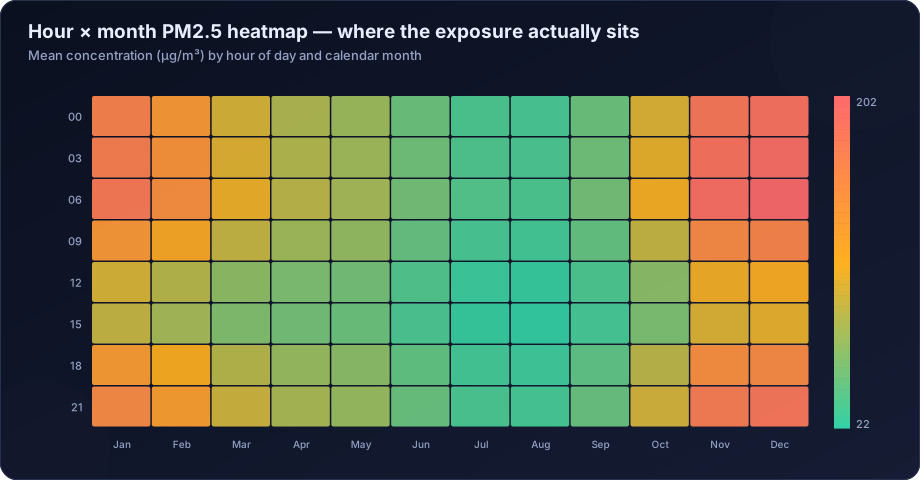
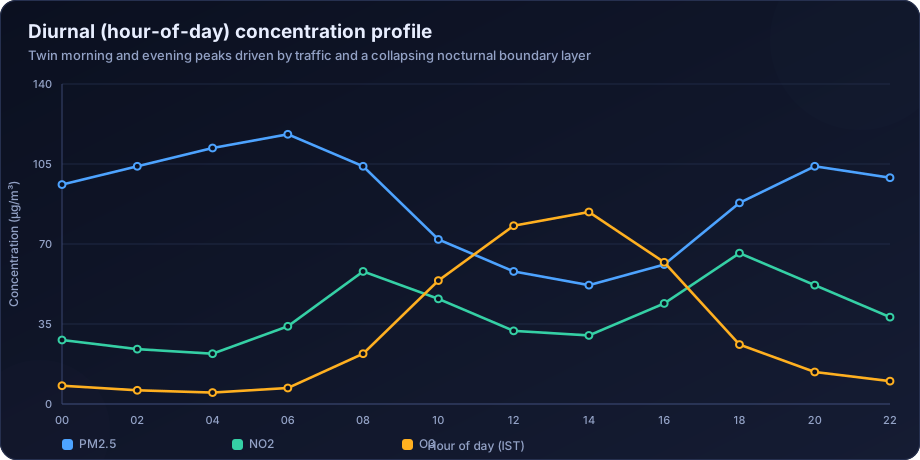
Diurnal profiling. The hour-of-day pattern separates emission-driven variation from boundary-layer-driven variation, and is diagnostic of source type.
Weekday-weekend analysis. A clear weekly cycle indicates traffic and industrial activity; its absence points to domestic, regional or natural sources.
Episode analysis. Hourly data lets you resolve the onset, peak and decay of a pollution episode, and correlate it against wind shifts, temperature inversions and known events.
Bivariate polar plots. Concentration as a joint function of wind speed and direction — the single most informative diagnostic plot available from a CAAQMS, and the basis for local source identification described in source apportionment.
Real-time AQI computation, following the methodology in how to calculate the AQI in India.
Correlation between parameters. PM2.5 rising with CO and NOx indicates combustion; PM2.5 rising alone indicates dust or secondary aerosol.
Forecasting. Hourly history with meteorology is the training set for the models described in air quality forecasting with machine learning.
What CAAQMS Data Cannot Do
- It cannot support source apportionment on its own. There is no chemical speciation in a standard CAAQMS, so PMF is not possible from the public feed.
- It cannot substitute for site-specific baseline monitoring in an EIA, where a station at the project site with the prescribed method and duration is generally required. See ambient air quality monitoring for EIA in India.
- It cannot describe a whole city from one station. Spatial variability within Indian cities is large; a single station describes its own neighbourhood.
- It cannot establish compliance without validation. Raw public data is operational, not validated, and compliance determination requires validated data with a stated capture rate.
A Practical CAAQMS Analysis Workflow
- Download and archive raw data unmodified, with all flag columns retained.
- Structure into long format with parsed IST timestamps; check for duplicate and missing timestamps.
- Validate — apply status flags, range checks, stuck-value detection, rate-of-change tests, internal consistency (PM2.5 ≤ PM10, NO ≤ NOx), cross-parameter coherence and cross-station coherence.
- Assess and document data capture per parameter, per month, with seasonal distribution.
- Aggregate to 24-hour, 8-hour rolling maximum, monthly and annual using the correct rules.
- Explore — distributions, diurnal, weekly and seasonal profiles, heatmaps, box plots by station.
- Join meteorology — polar plots, wind-sector analysis, correlation with wind speed and mixing conditions.
- Compare against NAAQS using the correct averaging periods, exceedance counts and the 98th percentile test.
- Test trends with seasonal Mann-Kendall and Theil-Sen, after meteorological normalisation.
- Report with methods, capture rates, flags and limitations documented.
How DSTechnoverse Helps
DSTechnoverse works with CAAQMS data daily, for industries tracking their surroundings, consultancies preparing baseline chapters, municipal programmes reporting progress, and researchers who need a defensible dataset rather than a download.
- Data acquisition and pipeline build — automated retrieval, structuring, timestamp handling and archiving, so the dataset is refreshed continuously instead of assembled by hand before each deadline.
- Instrument-aware validation — calibration-cycle removal, drift detection, converter-efficiency artefacts, stalled meteorological sensors, and every generic validation test, with full flagging and an audit trail.
- Correct aggregation — 24-hour means, rolling 8-hour maxima, monthly and annual statistics, percentiles and exceedance counts, all with enforced data-capture rules.
- Analysis — diurnal and seasonal decomposition, polar plots, cross-station comparison, trend testing, AQI computation, and correlation with meteorology.
- Dashboards and reporting — live or periodic reporting built on validated rather than raw data, with the capture statement visible rather than buried.
Where the CAAQMS record is being used to support a regulatory submission, we integrate it with site-specific monitoring and dispersion modelling so the measured background and the predicted increment are assessed on a consistent basis.
Need air quality data turned into a defensible answer? DSTechnoverse provides end-to-end air quality analysis services — monitoring data validation, statistical analysis, source apportionment, dispersion modelling, GIS mapping, and regulator-ready reporting. Talk to our air quality team about your dataset or project.
Frequently Asked Questions
What is CAAQMS?
Continuous Ambient Air Quality Monitoring Station — an automated monitoring cabin housing continuous analysers that measure pollutant concentrations in real time, typically at hourly resolution, along with meteorological parameters. India operates a large national network whose data is transmitted to state pollution control boards and CPCB.
Is CPCB CAAQMS data validated?
The public real-time feed is operational data, not validated data. Values appear within the hour, before any review. It includes calibration periods, instrument faults and drift. Before it is used for any analytical or compliance purpose it must be validated with instrument-aware checks and a data-capture assessment.
How do I download CAAQMS data for analysis?
Through the CPCB CCR dashboard, which allows selection of station, parameter and date range, or through the relevant state pollution control board portal. For sub-hourly data, instrument status flags or calibration logs, a direct data-sharing arrangement with the operating agency is usually necessary.
What is the minimum data capture for a valid CAAQMS average?
At least 75% of possible records. For a 24-hour average that means at least 18 valid hours; for monthly and annual means, at least 75% of valid days. Annual figures should also have valid data reasonably distributed across seasons, otherwise the mean is representative of a season rather than the year.
Why does CAAQMS PM data sometimes differ from gravimetric measurements?
Because the measurement principles differ. Beta attenuation and TEOM instruments can under-report semi-volatile components such as ammonium nitrate in warm conditions, while gravimetric filters lose some volatiles during conditioning. Differences of 10–20% between co-located instruments are not unusual and should be characterised rather than ignored.
Can CAAQMS data be used for EIA baseline studies?
It provides valuable regional context and can supplement a baseline, but most EIA requirements call for site-specific monitoring at prescribed locations, using prescribed methods, for a prescribed duration. CAAQMS data alone rarely satisfies the baseline requirement, though it is extremely useful for interpreting and cross-checking site data.
What are the most common errors when analysing CAAQMS data?
Ignoring the status flag column so calibration periods enter the dataset, computing 8-hour ozone as fixed blocks instead of a rolling maximum, aggregating in UTC instead of IST, deleting negative values and biasing the mean, and publishing averages without checking data capture.
Can I compute AQI from downloaded CAAQMS data?
Yes, provided you validate the data first, use the correct averaging periods for each pollutant, enforce the minimum-data rule requiring at least three pollutants including PM2.5 or PM10, and take the maximum sub-index rather than an average. Computing AQI from raw unvalidated hourly data is a common source of incorrect published figures.
Related services
Related articles
- Air Quality Analysis: The Complete Guide to Parameters, Methods and Data Interpretation
- Air Quality Compliance Reporting Against NAAQS: Percentiles, Exceedances and Defensible Statistics
- Air Quality Forecasting with Machine Learning: Models, Features and Honest Validation
- Air Quality GIS Mapping: Spatial Interpolation, Kriging and Exposure Surfaces