Ask three environmental teams which air quality parameters they monitor and you will often get three different lists. That inconsistency is not academic. The parameter list decides which instruments are deployed, what a study costs, what conclusions are available at the end, and whether a regulator accepts the work. This guide explains every parameter that matters in Indian and international air quality practice: what it is, where it comes from, how it behaves, how it is measured, what the limits are, and — most usefully — what its concentration is actually telling you about the airshed.
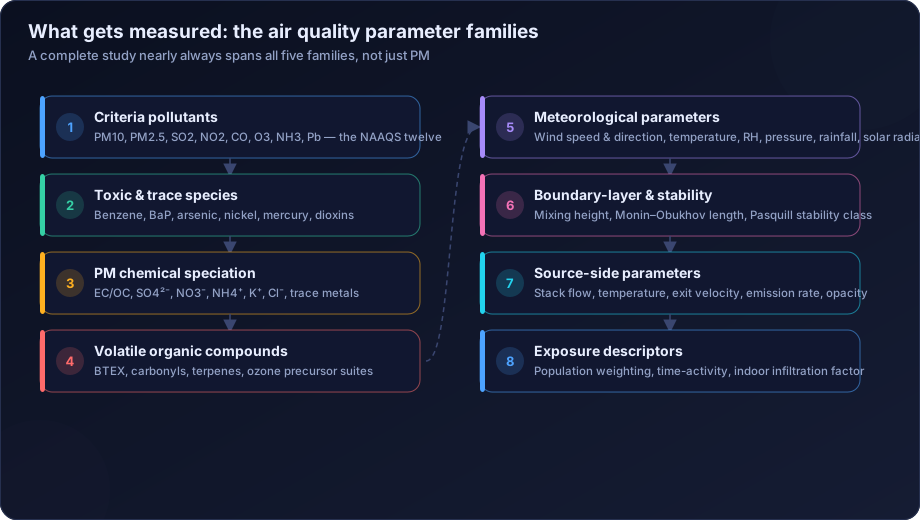
Air quality parameters are the specific pollutants and supporting atmospheric variables measured to characterise ambient air. India's National Ambient Air Quality Standards prescribe twelve pollutants — PM10, PM2.5, SO2, NO2, CO, O3, NH3, lead, benzene, benzo(a)pyrene, arsenic and nickel — while a complete analysis also requires meteorological parameters, boundary-layer variables and, for source work, chemical speciation of particulate matter.
The NAAQS Twelve: India's Regulated Parameters
The CPCB National Ambient Air Quality Standards, notified in 2009, are the legal reference point for every compliance determination in India. Here is the full set, with the limits that matter.
| Parameter | Averaging period | Industrial / residential / rural limit | Ecologically sensitive area limit |
|---|---|---|---|
| PM10 (µg/m³) | Annual | 60 | 60 |
| PM10 (µg/m³) | 24-hour | 100 | 100 |
| PM2.5 (µg/m³) | Annual | 40 | 40 |
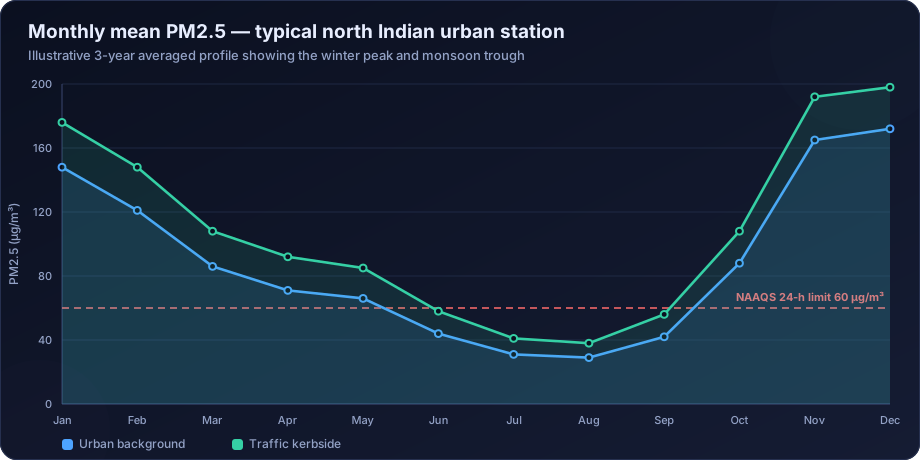
| PM2.5 (µg/m³) | 24-hour | 60 | 60 |
| SO2 (µg/m³) | Annual | 50 | 20 |
| SO2 (µg/m³) | 24-hour | 80 | 80 |
| NO2 (µg/m³) | Annual | 40 | 30 |
| NO2 (µg/m³) | 24-hour | 80 | 80 |
| O3 (µg/m³) | 8-hour | 100 | 100 |
| O3 (µg/m³) | 1-hour | 180 | 180 |
| CO (mg/m³) | 8-hour | 2 | 2 |
| CO (mg/m³) | 1-hour | 4 | 4 |
| NH3 (µg/m³) | Annual | 100 | 100 |
| NH3 (µg/m³) | 24-hour | 400 | 400 |
| Lead (µg/m³) | Annual | 0.5 | 0.5 |
| Benzene (µg/m³) | Annual | 5 | 5 |
| Benzo(a)pyrene (ng/m³) | Annual | 1 | 1 |
| Arsenic (ng/m³) | Annual | 6 | 6 |
| Nickel (ng/m³) | Annual | 20 | 20 |
Two rules govern how these numbers are applied, and both are routinely misread. First, the 24-hour and 1-hour limits are 98th-percentile standards: they may be exceeded on up to 2% of monitored days in a year, but never on two consecutive days. Second, an annual figure is the arithmetic mean of a minimum of 104 measurements taken twice a week at uniform intervals — or, for continuous monitors, a year with adequate data capture. Our detailed treatment is in NAAQS standards in India explained and the compliance mechanics are in air quality compliance reporting against NAAQS.
Particulate Matter: PM10 and PM2.5
What they are
Particulate matter is not a chemical, it is a size class. PM10 is everything with an aerodynamic diameter of 10 micrometres or less; PM2.5 is the fraction at or below 2.5 micrometres. PM2.5 is a subset of PM10, which is why any dataset showing PM2.5 above PM10 has a validation failure, not a finding.
Below the regulated fractions sit ultrafine particles (PM0.1) and, increasingly discussed, PM1. Neither is regulated in India, but both are analytically informative — a rising PM1 fraction points to combustion rather than dust.
Where they come from
| Fraction | Dominant sources | Character |
|---|---|---|
| Coarse (PM2.5–PM10) | Road dust resuspension, construction, soil, mechanical abrasion, sea salt | Primary, locally generated, settles within kilometres |
| Fine (PM2.5) | Combustion — vehicles, industry, biomass, cooking — plus secondary aerosol | Primary and secondary, travels hundreds of kilometres |
The PM2.5/PM10 ratio is a diagnostic
This single derived parameter is one of the most useful and most underused in Indian practice:
- Ratio 0.2–0.4 — dust-dominated. Think construction sites, unpaved roads, mining, arid post-monsoon conditions.
- Ratio 0.5–0.7 — mixed urban with significant combustion.
- Ratio above 0.7 — combustion and secondary aerosol dominated. Typical of north Indian winter smog episodes. The health rationale for prioritising the fine fraction is set out in the WHO Air Quality Guidelines 2021.
A station whose ratio jumps from 0.35 in May to 0.78 in December is telling you the winter problem is not the same problem as the summer problem, and the control strategy therefore cannot be the same either. Full treatment in PM2.5 and PM10 data analysis.
How PM is measured
- Gravimetric (reference) — pull a known air volume through a conditioned filter, weigh before and after on a microbalance. Highest accuracy, 24-hour resolution, no chemistry lost — the filter can then go for speciation.
- Beta attenuation monitor (BAM) — continuous, measures attenuation of beta radiation through collected mass. Hourly resolution, widely deployed in CAAQMS.
- Tapered element oscillating microbalance (TEOM) — continuous mass by resonant frequency shift; can under-read semi-volatiles unless equipped with a filter dynamics measurement system.
- Optical / nephelometric — scattering-based, used in low-cost sensors. Fast and cheap, but responds to particle size distribution and humidity rather than mass directly.
Sulphur Dioxide (SO2)
SO2 comes overwhelmingly from sulphur in fuel: coal combustion, oil refining, non-ferrous smelting, sulphuric acid plants and diesel generators. It is a sharp, acrid gas measured by pulsed UV fluorescence in continuous analysers, or by the improved West and Gaeke method in manual sampling.
Its analytical importance goes beyond direct toxicity. SO2 oxidises in the atmosphere to sulphate aerosol, which is a major component of secondary PM2.5. This means a coal plant can be fully compliant on stack SO2 and still contribute meaningfully to PM2.5 hundreds of kilometres downwind — a mechanism that only long-range dispersion modelling and receptor modelling can capture.
Indian ambient SO2 is generally low and falling, thanks to sulphur reduction in transport fuel and FGD retrofits. When a station reports unexpectedly high SO2, the usual explanations are a nearby uncontrolled boiler, a DG set, or an interference artefact worth investigating before it is reported.
Nitrogen Dioxide (NO2) and Oxides of Nitrogen (NOx)
Combustion at high temperature produces mostly nitric oxide (NO), which oxidises to NO2 in the atmosphere. Analysers measure NO and NOx by chemiluminescence and report NO2 by difference — which is why an internal consistency check (NO must never exceed NOx) is a standard validation test.
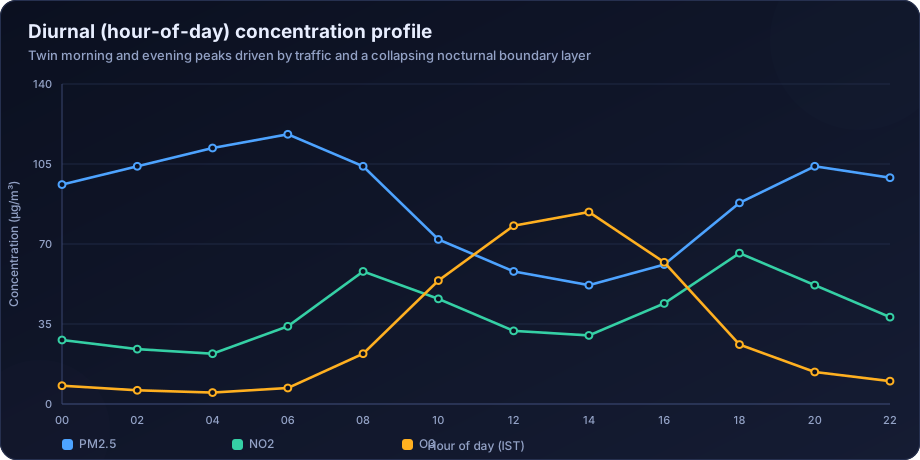
NO2 is a traffic tracer, an ozone precursor, and a nitrate aerosol precursor. Its diurnal profile is one of the most informative plots in urban air quality: a morning peak as traffic builds under a shallow boundary layer, a midday dip as photochemistry converts NO2 to ozone and mixing deepens, and an evening peak as traffic returns and the boundary layer collapses.
Carbon Monoxide (CO)
CO is the product of incomplete combustion — petrol vehicles, biomass cooking, idling engines, and poorly tuned boilers. It is measured by non-dispersive infrared (NDIR) spectroscopy and reported in mg/m³ rather than µg/m³, which is a common unit error in compiled datasets.
Ambient CO rarely approaches the health limits in outdoor Indian air, which leads teams to under-value it. Analytically it is very useful: CO is chemically stable over hours to days and is emitted almost exclusively by combustion, making it an excellent tracer. The CO/NOx ratio distinguishes petrol from diesel sources; the CO/PM2.5 ratio distinguishes biomass burning from vehicular exhaust.
Ozone (O3)
Ozone is the parameter that behaves backwards, and it catches out analysts trained on primary pollutants. It has no direct emission source. It forms photochemically from NOx and VOCs under sunlight, which produces four counter-intuitive properties:
- It peaks in the afternoon, not the rush hour.
- It is often higher downwind of a city than inside it, because fresh NO scavenges ozone near the source.
- Cutting NOx alone can raise urban ozone in VOC-limited regimes.
- It peaks in summer, opposite to the PM2.5 winter maximum.
Ozone is measured by UV photometry. Because the 8-hour standard is a rolling maximum, computing it correctly requires care: you calculate every 8-hour rolling mean in the day and take the maximum, not the mean of three fixed blocks.
Ammonia (NH3)
India is one of the few countries to regulate ambient ammonia, reflecting an agricultural emission profile dominated by fertiliser application and livestock. NH3 is measured by chemiluminescence with a converter, or by wet chemical methods.
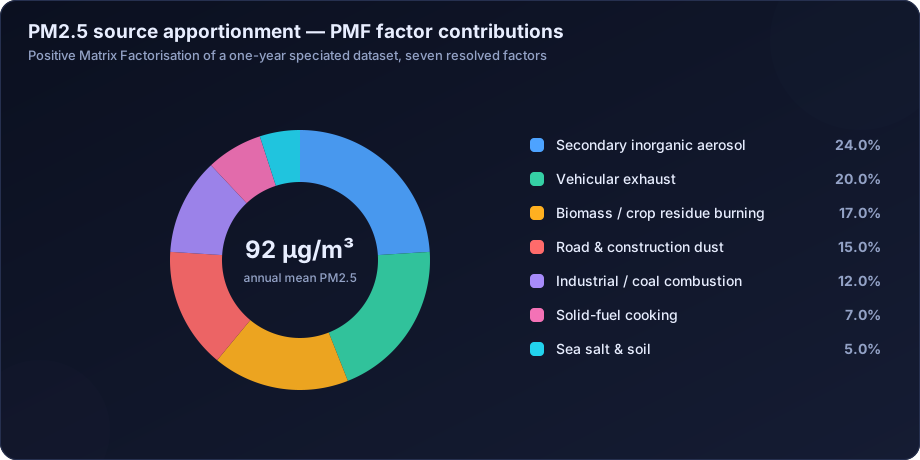
Its analytical significance is disproportionate to its regulatory profile. Ammonia neutralises sulphuric and nitric acid in the atmosphere to form ammonium sulphate and ammonium nitrate — two of the largest components of Indian PM2.5. In many source apportionment studies the "secondary inorganic aerosol" factor is the single largest contributor, and ammonia is a necessary ingredient in it.
Lead and Trace Metals
Lead is collected on filters and analysed by atomic absorption spectroscopy or ICP-MS. Ambient lead collapsed after the phase-out of leaded petrol, and residual hotspots are almost always industrial: secondary lead smelting, informal battery recycling, and some glass and ceramic operations.
Where lead is elevated, the analysis should extend to the wider trace metal suite — arsenic, nickel, cadmium, chromium, zinc, manganese. Metal ratios are strong source fingerprints, and this is exactly the data that PMF needs.
Volatile Organic Compounds
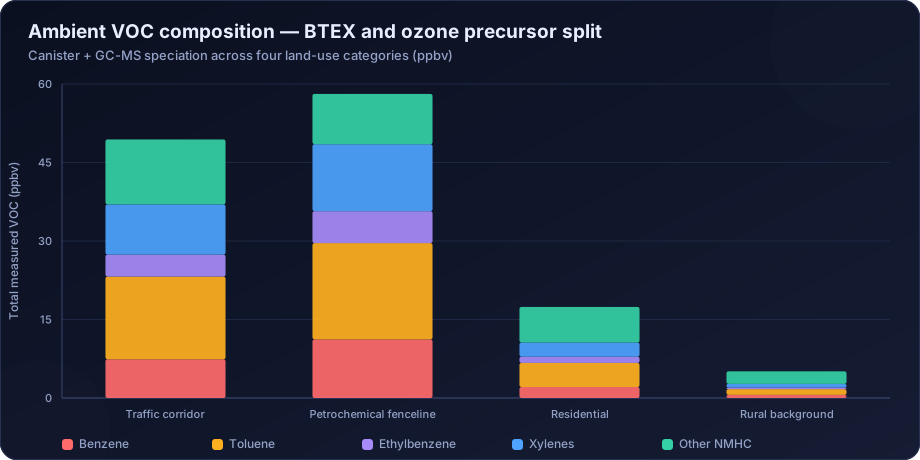
Benzene is regulated at 5 µg/m³ annual; the wider VOC family is not, but is analytically essential wherever solvents, fuels or petrochemicals are present. BTEX compounds are sampled with canisters or sorbent tubes and analysed by GC-MS. The toluene/benzene ratio distinguishes vehicular emissions (roughly 2–4) from solvent evaporation (often above 10).
Meteorological Parameters: Not Optional
| Parameter | Unit | Analytical role |
|---|---|---|
| Wind speed | m/s | Dilution rate; low speed drives accumulation |
| Wind direction | degrees | Source attribution, sector analysis, wind roses |
| Temperature | °C | Photochemistry, plume rise, inversion detection |
| Relative humidity | % | Hygroscopic growth, sensor correction, secondary formation |
| Barometric pressure | hPa | Concentration normalisation, synoptic context |
| Rainfall | mm | Wet deposition and washout |
| Solar radiation | W/m² | Ozone formation, stability classification |
| Mixing height | m | Dilution volume; explains most seasonal variation |
The most common analytical mistake in Indian air quality reporting is presenting concentration data with no accompanying meteorology, then attributing every change to emissions. See meteorological normalisation of air quality data for the correction.
Source-Side Parameters
For industrial work, ambient parameters are only half the story. Stack-side monitoring measures flue gas flow rate, temperature, exit velocity, oxygen or CO2 content (needed to normalise concentrations to reference conditions), moisture, and the pollutant concentration itself. Continuous Emission Monitoring Systems provide this in real time — see stack emission monitoring data analysis — and the resulting emission rates feed directly into the emission inventory for dispersion modelling.
Choosing the Right Parameter Set
| Study type | Minimum parameter set | Recommended additions |
|---|---|---|
| EIA baseline | PM10, PM2.5, SO2, NO2, CO, O3, NH3 + full met | Project-specific toxics, VOCs |
| Consent compliance | Parameters named in the consent | Met data for interpretation |
| Source apportionment | PM2.5 + PM10 mass | EC/OC, ions, trace metals, VOCs |
| Health risk assessment | PM2.5 (long-term), NO2 | Speciation, indoor measurement, time-activity |
| Urban action plan | Full NAAQS suite, multi-station | Speciation, sensor network, satellite |
| Industrial fenceline | Process-specific pollutants | VOCs, met, continuous rather than manual |
How DSTechnoverse Helps
DSTechnoverse advises clients on parameter selection before a single instrument is deployed, because that decision constrains every conclusion available at the end of the study. Our air quality team supports:
- Parameter scoping — matching the parameter list to the regulatory endpoint, the process, the sector and the budget, so you do not pay for data you cannot use or discover a missing parameter at appraisal stage.
- Monitoring design review — station siting, land-use classification, duration, frequency, and the placement of upwind reference stations.
- Laboratory and speciation coordination — EC/OC, ion chromatography and trace metal analysis specified correctly so the results are usable in PMF.
- Data validation and analysis — every parameter checked for range, consistency and traceability, then analysed against the correct averaging period and standard.
- Interpretation — diagnostic ratios, diurnal and seasonal profiles, source signatures, and a narrative explaining what the parameters mean rather than only what they measured.
Clients receive a validated parameter-wise dataset, comparison tables against NAAQS and WHO guidelines, diagnostic plots, and interpretation written for regulatory review — through our air quality analysis service or as a white-label input to your own report.
Need air quality data turned into a defensible answer? DSTechnoverse provides end-to-end air quality analysis services — monitoring data validation, statistical analysis, source apportionment, dispersion modelling, GIS mapping, and regulator-ready reporting. Talk to our air quality team about your dataset or project.
Frequently Asked Questions
How many air quality parameters are in India's NAAQS?
Twelve: PM10, PM2.5, SO2, NO2, CO, O3, NH3, lead, benzene, benzo(a)pyrene, arsenic and nickel. Most routine monitoring covers the first eight, with the four toxics measured where the process or land use makes them relevant.
What is the difference between PM2.5 and PM10?
Both are size classes of airborne particles. PM10 includes everything up to 10 micrometres in aerodynamic diameter; PM2.5 is the finer subset at or below 2.5 micrometres. PM2.5 penetrates deeper into the lungs, travels much further, and is more closely associated with health effects, while PM10 is dominated by locally generated dust.
Why is ammonia measured in India but not in many other countries?
India's emission profile includes very large agricultural ammonia sources from fertiliser use and livestock. Ammonia reacts with sulphuric and nitric acid to form ammonium sulphate and ammonium nitrate, which are major components of Indian PM2.5. Measuring it is therefore essential to understanding secondary particulate formation.
Which parameter is most important to monitor?
PM2.5, if only one can be measured, because it has the strongest health evidence base and is the pollutant most frequently in exceedance across India. However, a single-parameter study cannot support source attribution or explain why concentrations vary, so a defensible study measures PM2.5 alongside PM10, gases and meteorology.
What are secondary pollutants and why do they complicate analysis?
Secondary pollutants such as ozone, sulphate, nitrate and ammonium aerosol are not emitted directly; they form in the atmosphere from precursor gases. This means their concentration at a location may have little to do with local emissions, and controlling them requires reducing precursors that may be emitted far away.
Do I need meteorological data if I am only checking compliance?
Compliance itself is determined from concentration data alone, but any interpretation of that data requires meteorology. Without wind speed, direction and mixing height you cannot explain an exceedance, attribute it to a source, defend it during appraisal, or demonstrate that a control measure worked.
What is chemical speciation of PM and when is it needed?
Speciation resolves collected particulate mass into its chemical components — elemental and organic carbon, water-soluble ions and trace metals. It is required whenever the study aims to identify sources, because mass concentration alone contains no source information. It is the essential input to receptor models such as PMF and CMB.
Related services
Related articles
- Air Quality Analysis: The Complete Guide to Parameters, Methods and Data Interpretation
- Air Quality Compliance Reporting Against NAAQS: Percentiles, Exceedances and Defensible Statistics
- Air Quality Forecasting with Machine Learning: Models, Features and Honest Validation
- Air Quality GIS Mapping: Spatial Interpolation, Kriging and Exposure Surfaces