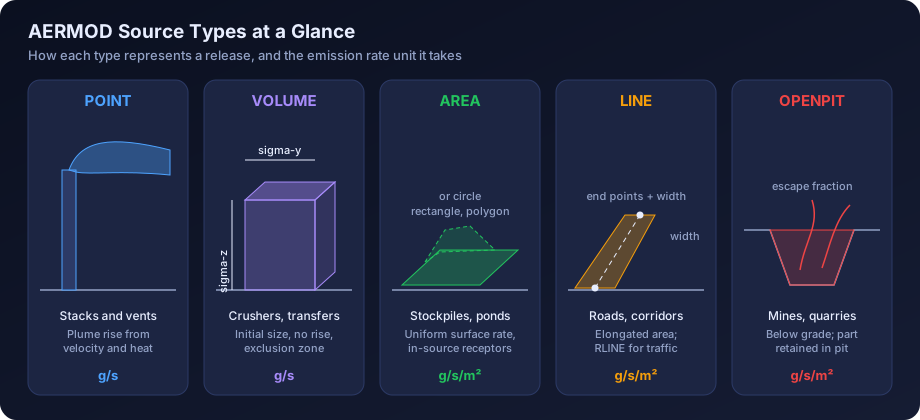
Quick answer: AERMOD represents emissions as point, volume, area (rectangle, polygon or circle), line, open pit and buoyant line sources, with RLINE types for roads. Stacks and vents are point sources; fugitive dust from stockpiles, conveyors, crushers and haul roads is usually modelled as volume or area sources; pits use the OPENPIT type. The choice changes the required parameters, the emission rate units (g/s for point and volume, g/s/m² for area, line and open pit) and, often, the predicted ground-level concentrations.
Every AERMOD run starts with a decision that is easy to get wrong: how should each real emission point be described to the model? A boiler stack is obvious. A coal stockpile, a haul road or an effluent treatment lagoon is not. The source type decides the dispersion algorithm, the parameters, the emission rate units, and whether nearby receptors are calculated at all.
This guide walks through each AERMOD source type in turn, with the parameters it needs, the Indian industrial situations where it fits, and the mistakes we see most often in reports submitted for Environmental Clearance and Consent to Establish. It finishes with a worked example that converts a stockpile and a haul road into AERMOD inputs, step by step. If you are still assembling your emission data, read our guide on building an emission inventory for dispersion modelling alongside this one.
Why Source Type Matters In AERMOD
AERMOD is a steady-state Gaussian plume model that adjusts plume spread using boundary-layer parameters from AERMET. For a point source it calculates plume rise from exit velocity and temperature, then disperses the plume from its effective height. For a volume or area source there is no plume rise: the emission starts with a defined initial size and a fixed release height. That difference alone can change the maximum ground-level concentration by an order of magnitude for the same emission rate.
The source type also controls three practical things:
- Units of emission rate. Point, volume and buoyant line sources take g/s. Area, polygon, circular area, line, RLINE and open pit sources take g/s/m², so the total emission must be divided by the source area.
- Near-field behaviour. Volume sources have an exclusion zone around them where receptors are not calculated. Area sources compute concentrations at receptors inside or at the edge of the source, which matters for fence-line receptors.
- Run time. Area-type sources need numerical integration and run slower than point or volume sources.
The table below summarises the source keywords available in current regulatory AERMOD.
| AERMOD keyword | Represents | Emission rate unit | Plume rise | Typical Indian examples |
|---|---|---|---|---|
| POINT | Vertical stack or vent | g/s | Yes (momentum and buoyancy) | Boiler, kiln, DG set, furnace, incinerator stacks |
| POINTCAP | Stack with rain cap | g/s | Reduced (momentum suppressed) | DG set stacks with flapper caps, small process vents |
| POINTHOR | Horizontal release | g/s | Buoyancy only | Side vents, horizontal exhausts from compressor houses |
| VOLUME | Three-dimensional release with initial spread | g/s | No | Crushers, transfer points, conveyor runs, haul road segments, building roof vents |
| AREA | Rectangle at a set height | g/s/m² | No | Stockpiles, storage yards, lagoons, landfill cells |
| AREAPOLY | Irregular polygon | g/s/m² | No | Odd-shaped stockyards, ash ponds, ETP basins |
| AREACIRC | Circle | g/s/m² | No | Circular tanks, clarifiers, conical piles |
| LINE | Long narrow rectangle defined by end points | g/s/m² | No | Roads, conveyor corridors (as an elongated area) |
| OPENPIT | Below-grade pit | g/s/m² | No | Open cast mines, quarries, deep excavations |
| BUOYLINE | Buoyant line sources (former BLP model) | g/s per line | Yes (line plume rise) | Aluminium smelter potlines, long roof monitors |
| RLINE and RLINEXT | Roadway sources | See section on roads | No | Highways, urban corridors, depressed or barriered roads |
Point Sources
A point source is any release through a defined opening where exit velocity and temperature can be measured or estimated. It is the most common source type in Indian EIA work because CPCB and SPCB consent conditions focus on stack emissions, and most stacks are monitored for particulate matter, SO2 and NOx.
Required Parameters
- Location (X, Y) and base elevation
- Emission rate (g/s)
- Stack height above ground (m)
- Exit gas temperature (K)
- Exit velocity (m/s)
- Inside stack diameter at the exit (m)
Building dimensions from BPIP are also needed if the stack is close to structures, because downwash can dominate the near-field result. Our article on building downwash and BPIP explains when it applies.
Indian Examples
Boiler, kiln, furnace, captive power plant, incinerator, DG set and process vent stacks are all point sources. CPCB industry-specific standards, generally concentration limits in mg/Nm³ at a reference oxygen level, give a useful upper bound when stack monitoring is not yet available. Stack heights are covered in our article on stack height calculation under CPCB guidelines.
Capped, Horizontal And Flare Releases
Many DG set stacks have rain caps or bend horizontally. Modelling these as vertical POINT sources overstates plume rise; POINTCAP and POINTHOR suppress momentum rise while keeping buoyancy. Flares are usually modelled as point sources with effective parameters derived from heat release and flame length, following US EPA screening guidance. Document the derivation, because reviewers will ask.
What AERMOD Studio Covers
AERMOD Studio, our browser-based AERMOD tool, currently models point sources only, on flat terrain with regulatory defaults. Projects that need volume, area, line, open pit or buoyant line sources are handled by our modelling team on the full desktop workflow.
Volume Sources
A volume source represents an emission that is already spread through a three-dimensional space when it leaves the source: dust from a crusher, a conveyor transfer point, a building with many roof vents, or a haul truck stirring up road dust. AERMOD treats it as a Gaussian puff that starts with initial lateral and vertical dimensions, then grows with downwind distance.
Required Parameters
- Location (X, Y) of the centre and base elevation
- Emission rate (g/s)
- Release height (m): the centre of the volume above ground
- Initial lateral dimension, sigma-y (m)
- Initial vertical dimension, sigma-z (m)
How To Estimate Sigma-y And Sigma-z
The AERMOD User's Guide gives standard rules, which most reviewers expect you to follow.
| Situation | Initial lateral dimension (sigma-y) | Initial vertical dimension (sigma-z) |
|---|---|---|
| Single volume source | Length of side ÷ 4.3 | Surface-based: vertical dimension ÷ 2.15 |
| Line of adjacent volumes (for example a road or conveyor) | Length of side ÷ 2.15 | Elevated, not on a building: vertical dimension ÷ 4.3 |
| Line of separated volumes | Centre-to-centre distance ÷ 2.15 | Elevated, on or next to a building: building height ÷ 2.15 |
For a surface-based volume, release height is usually half the vertical dimension. For a crusher in a partly enclosed building, the building sets both dimensions.
The Exclusion Zone
AERMOD does not calculate concentrations at receptors that lie within 2.15 × sigma-y plus 1 m of the centre of a volume source. Those receptors return zero, which can look like a low concentration in a contour plot. If your fence line is close to a large volume source, check that boundary receptors are not falling inside the exclusion zone. The receptor grid design guide covers boundary receptor spacing in more detail.
Indian Examples
Crushers in quarries and cement plants, coal and ore transfer towers, conveyor runs, screens, bagging and truck tipping points and unpaved haul road segments are commonly volume sources. A building with many small exhaust fans, such as a foundry fettling shop, can be one volume sized to the building.
Area Sources: Rectangle, Polygon And Circle
An area source represents emissions spread over a horizontal surface at a uniform rate: wind erosion from a stockpile, evaporation from a lagoon, emissions from a landfill cell or an ash pond. AERMOD integrates the contribution of the whole surface for each receptor, which means it can calculate concentrations accurately right at the edge of the source and even inside it.
The Three Shapes
- AREA (rectangle): defined by the south-west corner, X and Y side lengths, and a rotation angle. Good for regular stockyards and rectangular tanks.
- AREAPOLY (polygon): defined by a list of vertices. Use it for irregular boundaries traced from a site plan or satellite image, such as ash ponds or curved stockyards.
- AREACIRC (circle): defined by a centre and radius, which AERMOD converts internally to a polygon. Use it for circular clarifiers, conical piles and round tanks.
Required Parameters
- Location and base elevation
- Emission rate per unit area (g/s/m²)
- Release height above ground (m)
- Dimensions (side lengths and angle, vertices, or radius)
- Optional initial vertical dimension, sigma-z (m), for sources where emissions are mixed into a layer, such as a pile disturbed by wind
The single most frequent error with area sources is entering the total emission in g/s instead of g/s/m². Because a stockpile of 2,000 m² is involved, that error inflates concentrations by a factor of 2,000. Our list of common AERMOD mistakes has more examples of this type.
Indian Examples
Coal and limestone stockpiles, clinker yards, fly ash ponds, red mud ponds, effluent treatment plant aeration tanks and lagoons (for odour or VOC studies), sewage treatment plants, municipal landfill cells, sludge drying beds and salt pans are typical area sources. For odour work from ETP tanks and lagoons, the emission is usually an area-specific odour emission rate; see our article on odour dispersion modelling in India.
Line Sources
AERMOD's LINE source type is a convenience form of the rectangular area source: you define the start and end points of the centreline and a width, and AERMOD builds the elongated rectangle. The emission rate is therefore in g/s/m², not g/s per metre. LINE sources are useful for roads, long conveyors at grade and drainage channels when you prefer an area-based treatment.
Required Parameters
- Start point (X1, Y1) and end point (X2, Y2)
- Emission rate (g/s/m²)
- Release height (m)
- Width (m)
- Optional initial sigma-z (m)
Roads: RLINE And RLINEXT
For roadway emissions, AERMOD also has RLINE and RLINEXT source types derived from the R-LINE research model, designed specifically for near-road dispersion from traffic. RLINE has moved from a beta option into the regulatory model in recent AERMOD versions, following US EPA's revisions to the Guideline on Air Quality Models. RLINEXT adds features such as noise barriers and depressed roadways. Which features still need the BETA or ALPHA flag depends on the version, so confirm against the model change bulletin of the release you run. For an industrial site, internal paved roads are still often handled as a string of volume sources, as described below.
Open Pit Sources
The OPENPIT source type is designed for emissions released below grade, where part of the material is retained in the pit before escaping. AERMOD's algorithm calculates an escape fraction for particles, depending on particle size and pit geometry, then represents the escaping emission as an effective area source at the pit opening.
Required Parameters
- South-west corner location of the pit
- Emission rate per unit area (g/s/m²) of the pit opening
- Average release height above the base of the pit (m)
- Length and width of the pit opening (m) and rotation angle
- Volume of the pit (m³)
- For particles, the particle size distribution through the particle deposition inputs
Two checks matter. The release height must not exceed the effective depth of the pit (pit volume divided by opening area). The length-to-width ratio should stay within the limit stated in the User's Guide, so very elongated pits are better split into sections.
Indian Examples
Open cast coal, iron ore and bauxite mines, limestone and stone quarries, and large excavations. Mining EIAs often combine an OPENPIT source for drilling, blasting and loading in the pit with volume sources for haul roads and area sources for overburden dumps. The air quality modelling guide for mining projects discusses the mine-specific workflow.
Buoyant Line Sources
The BUOYLINE source type brings the older Buoyant Line and Point source model (BLP) into AERMOD. It is designed for long, parallel, hot sources that release buoyant emissions along their length, so that plume rise is a line-plume problem rather than a point-plume one.
Required Parameters
For the group of lines, you enter average building length, height and width, average line width, average separation between lines, and the average buoyancy parameter. For each individual line, you enter the end points, release height and emission rate in g/s.
Indian Examples
The classic case is an aluminium smelter potline, where hot, fluoride-bearing air escapes through roof monitors along very long potroom buildings. The method was developed for aluminium reduction plants and is best justified there.
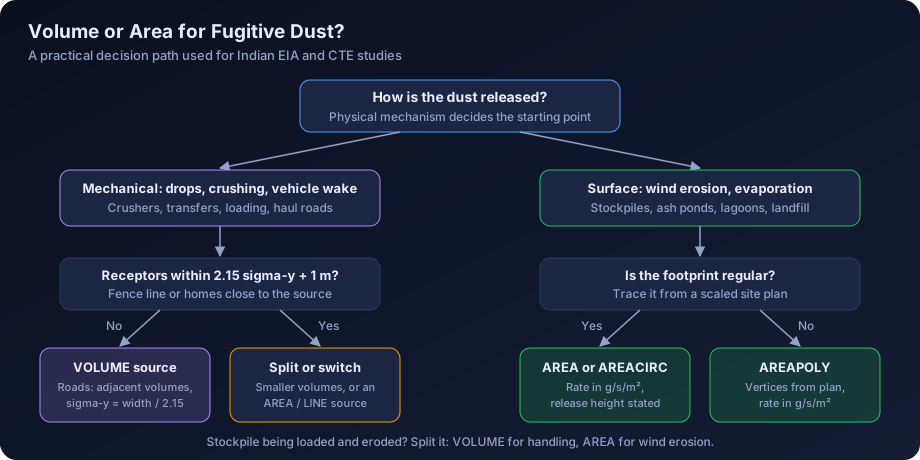
Volume Or Area For Fugitive Dust?
This is the question we are asked most often. Both are defensible for many sources; the choice depends on the geometry and where the receptors are.
| Factor | Favours volume source | Favours area source |
|---|---|---|
| Source geometry | Compact, with real height (crusher building, transfer tower) | Flat, large horizontal extent (stockyard, pond) |
| Nature of emission | Mechanically generated, mixed into a volume (vehicle wake, drop points) | Surface-driven (wind erosion, evaporation) |
| Nearest receptors | Beyond the exclusion zone | At the fence line or inside the footprint |
| Run time | Many sources, large grid | Few sources, smaller grid |
| Haul roads | Preferred by US EPA haul road guidance as adjacent volumes | Acceptable as LINE or AREA with care |
| Low wind, stable nights | Less sensitive | Can produce high near-source values with low release heights |
Practical rules that work for most Indian projects:
- Use volume sources for crushers, screens, transfer points, conveyor drop points and haul roads.
- Use area or polygon sources for stockpile wind erosion, ash ponds, lagoons and landfill cells.
- When a stockpile is also being loaded and reclaimed, split it: a volume source for the handling operation and an area source for wind erosion.
- If a sensitive receptor or the plant boundary sits within a few tens of metres of the source, area sources avoid the volume exclusion zone problem.
- Whatever you choose, state the reason in the report. Reviewers accept either approach when it is justified.
Emission Rate Units By Source Type
Getting units wrong is the most common reason a fugitive dust model produces absurd results. Use this table as a check.
| Source type | Unit entered in AERMOD | How to derive it from an annual inventory |
|---|---|---|
| POINT, POINTCAP, POINTHOR | g/s | Tonnes per year × 10⁶ ÷ operating seconds per year |
| VOLUME | g/s per volume | Total g/s ÷ number of volumes representing the source |
| AREA, AREAPOLY, AREACIRC | g/s/m² | Total g/s ÷ source area in m² |
| LINE | g/s/m² | Total g/s ÷ (length × width) |
| OPENPIT | g/s/m² | Total g/s ÷ pit opening area |
| BUOYLINE | g/s per line | Total g/s ÷ number of lines |
Remember also that if a source operates only part of the day, the g/s value should reflect operating hours, and the off hours should be set to zero with hourly emission factors (EMISFACT with HROFDY, for example). Averaging a 10-hour operation over 24 hours understates the 1-hour and 24-hour peaks during operation and overstates night-time values when the atmosphere is stable.
Worked Example: Turning A Stockpile And A Haul Road Into AERMOD Sources
The numbers below are illustrative only. They show the method, not the emissions of any real site. Emission factors for a real project should come from site data, AP-42 methods (for example the aggregate handling, wind erosion and unpaved road sections) or other accepted references, with silt content and moisture measured where possible.
Part A: A Coal Stockpile
Assume a coal stockpile 60 m long, 40 m wide and 8 m high. After applying wind erosion and handling emission factors with water sprinkling, the illustrative PM10 emission from wind erosion is 0.05 g/s averaged over the year, and loading and reclaiming add 0.08 g/s during 16 operating hours.
Step 1: split the source. Wind erosion is a surface process, so it becomes an area source. Loading and reclaiming is a mechanical drop process, so it becomes a volume source.
Step 2: area source for wind erosion.
- Area = 60 × 40 = 2,400 m²
- Emission rate = 0.05 ÷ 2,400 = 2.08 × 10⁻⁵ g/s/m²
- Release height: for a pile 8 m high, half the pile height (4 m) is a common, defensible choice; state it
- Side lengths 60 m and 40 m, with the rotation angle taken from the site plan
Step 3: volume source for handling.
- Treat the handling zone as a single volume source. Using the equivalent square side of the pile, √2,400 ≈ 49 m
- Sigma-y = 49 ÷ 4.3 ≈ 11.4 m
- Sigma-z for a surface-based source = 8 ÷ 2.15 ≈ 3.7 m
- Release height = 8 ÷ 2 = 4 m
- Emission rate = 0.08 g/s, applied only during the 16 operating hours using hourly factors
- Exclusion zone radius = 2.15 × 11.4 + 1 ≈ 25.5 m from the centre
Step 4: check the boundary. If the plant boundary is 20 m from the pile edge (about 40 m from its centre along the short axis), boundary receptors are outside the volume exclusion zone. If it were closer, the handling emission could be represented as a second area source instead.
Part B: An Unpaved Haul Road
Assume a 1.2 km unpaved haul road, 10 m wide, used by dumpers 3.5 m wide and 4 m high. The illustrative controlled PM10 emission factor after watering is 0.4 kg per vehicle kilometre travelled (VKT), with 120 round trips per day over 16 operating hours.
Step 1: emission.
- VKT per day = 120 trips × 2.4 km (round trip) = 288 km
- PM10 per day = 288 × 0.4 = 115.2 kg
- Emission rate during operation = 115,200 g ÷ (16 × 3,600 s) = 2.0 g/s
Step 2: geometry using the US EPA haul road workgroup approach.
- Adjusted road width for a two-lane road = road width + 6 m = 16 m
- Top of plume height = 1.7 × vehicle height = 1.7 × 4 = 6.8 m
- Release height = half the top of plume = 3.4 m
- Sigma-z = 6.8 ÷ 2.15 ≈ 3.2 m
Step 3: volume source string.
- Volume spacing equal to the adjusted width: 1,200 ÷ 16 = 75 volumes
- Sigma-y for adjacent volumes = 16 ÷ 2.15 ≈ 7.4 m
- Emission per volume = 2.0 ÷ 75 ≈ 0.027 g/s
- Hourly factors set to zero outside the 16 operating hours
Step 4: the area alternative. If you model the same road as a LINE source instead, the area is 1,200 × 16 = 19,200 m², and the emission rate becomes 2.0 ÷ 19,200 ≈ 1.04 × 10⁻⁴ g/s/m², with a release height of 3.4 m and initial sigma-z of 3.2 m. Running both and comparing the fence-line results is a useful sensitivity test.
Step 5: group and report. Put all 75 volumes into one source group named for the road, so the contribution of haul traffic can be reported separately from stacks and stockpiles. Report each assumption in a source parameter table, as described in our guide to air dispersion modelling report contents.
| Parameter | Stockpile (area) | Stockpile handling (volume) | Haul road (75 volumes) |
|---|---|---|---|
| Emission rate | 2.08 × 10⁻⁵ g/s/m² | 0.08 g/s | 0.027 g/s each |
| Release height | 4 m | 4 m | 3.4 m |
| Sigma-y | Not applicable | 11.4 m | 7.4 m |
| Sigma-z | Optional | 3.7 m | 3.2 m |
| Operating pattern | 24 hours | 16 hours | 16 hours |
All values are illustrative.
Indian Regulatory Context
Under the EIA Notification 2006, the Terms of Reference for most Category A and B industrial and mining projects ask for prediction of ground-level concentrations from the proposed activity and a comparison of the predicted plus baseline values with the National Ambient Air Quality Standards 2009. For PM10, the 24-hour limit is 100 µg/m³ and the annual limit is 60 µg/m³; for PM2.5 they are 60 and 40 µg/m³. The 24-hourly values must be met 98% of the time in a year. Fugitive sources often drive the PM10 result close to the boundary, so a credible representation of stockpiles and roads matters as much as stack modelling. Our explainer on air dispersion modelling for EIA in India sets out the full process.
For CTE applications, show SPCB reviewers the uncontrolled emission, the control efficiency assumed for sprinkling, covers or wind barriers, its reference, and the controlled emission that went into the model.
Common Mistakes With AERMOD Source Types
- Total g/s entered for an area, line or open pit source. Always divide by area.
- Every fugitive source modelled as one big area source. This spreads emissions unrealistically and hides the effect of handling points close to the boundary.
- Volume sources with sigma-y based on the wrong rule. Using the single-volume divisor (4.3) for adjacent road volumes halves the initial spread.
- Receptors inside volume exclusion zones. These return zero and can make fence-line results look acceptable when they are not.
- Point source parameters for DG sets with rain caps. Use POINTCAP or POINTHOR, or document why not.
- Daytime-only operations averaged over 24 hours. Use hourly emission factors.
- Open pit release height deeper than the pit. AERMOD will flag or reject it, but some runs are forced through with wrong geometry.
- No source groups. Without groups, you cannot show the contribution of stacks versus fugitive sources, which reviewers expect.
- Area sources drawn from a schematic rather than a scaled plan. Coordinates must be in the same projection as the receptors and terrain, which is covered in our article on terrain and land use data for AERMOD.
Before running, use our AERMOD input data checklist to confirm units, release heights, operating hours, coordinates and source groups. If you want a refresher on how AERMOD uses meteorology and terrain with these sources, see how AERMOD works.
How DSTechnoverse Helps
DSTechnoverse sets up and runs AERMOD studies that combine stacks with fugitive sources, using volume, area, polygon, line, open pit and buoyant line representations matched to each release, with documented emission estimates and source parameter tables. Our AERMOD modelling service covers Environmental Clearance, CTE and expansion studies, including white-label work for EIA consultancies. For point-source projects, AERMOD Studio lets your team run real US EPA AERMOD in the browser, and multi-source-type projects go to our modelling team. To discuss your sources, talk to our team.
Frequently Asked Questions
What are the main source types in AERMOD? AERMOD supports point sources (including capped and horizontal stacks), volume sources, area sources as rectangles, polygons or circles, line sources, open pit sources, buoyant line sources and the RLINE roadway source types. Each type uses a different dispersion treatment and set of parameters, so the choice should follow the physical way the emission is released, not convenience.
Should a stockpile be modelled as an area source or a volume source? Wind erosion from a stockpile is normally modelled as an area or polygon source, because it is a surface process spread over the pile. Loading, stacking and reclaiming are mechanical drop operations and are better represented as volume sources. Splitting the stockpile into these two parts gives a more realistic result than one combined source and is easier to justify to reviewers.
What units does AERMOD use for area source emission rates? Area, polygon, circular area, line and open pit sources take emission rates in grams per second per square metre. Point, volume and buoyant line sources take grams per second. To convert, divide the total g/s emission by the plan area of the source in square metres. Entering the total in g/s for an area source is one of the most damaging and common errors.
How do I calculate sigma-y and sigma-z for a volume source? For a single volume, sigma-y is the side length divided by 4.3; for adjacent volumes in a line, it is the side length divided by 2.15. For a surface-based source, sigma-z is the vertical dimension divided by 2.15. Elevated sources and those on buildings use different divisors, given in the AERMOD User's Guide.
Why does AERMOD show zero concentration near my volume source? AERMOD does not calculate concentrations at receptors within 2.15 times sigma-y plus 1 metre of a volume source centre. Those receptors return zero. If boundary receptors fall in this zone, either move them, reduce the volume size by splitting the source, or use an area source, which calculates concentrations at the edge and inside the footprint.
How should haul roads be modelled in AERMOD? Most practitioners follow the US EPA haul road workgroup approach: a string of adjacent volume sources with spacing equal to the adjusted road width, top of plume height of 1.7 times the vehicle height, release height at half the plume height and sigma-z equal to plume height divided by 2.15. Line or area representations are also accepted when justified.
When should I use the OPENPIT source type? Use OPENPIT when emissions are released below grade, as in open cast mines, quarries and deep excavations. AERMOD calculates how much particulate escapes the pit based on particle size and geometry. Release height must not exceed the effective pit depth, and very long pits should be split into sections to stay within the length-to-width limit.
Can AERMOD Studio model area, volume or line sources? Not at present. AERMOD Studio currently models point sources on flat terrain with regulatory default options. Projects that include stockpiles, haul roads, crushers, pits, lagoons or buoyant line sources are set up and run by the DSTechnoverse modelling team, who can also combine those results with your point source runs.
What is a buoyant line source used for? The BUOYLINE source type models long, hot, parallel releases where plume rise behaves like a line plume rather than from a single point. It was developed for aluminium reduction plants, where emissions escape through roof monitors along long potroom buildings. It needs building and line geometry plus an average buoyancy parameter for the group of lines.
Need an AERMOD study or AERMOD software? DSTechnoverse runs regulatory AERMOD modelling studies for EC, CTE and expansion applications, for industries and as a white-label partner for EIA consultancies, and provides AERMOD Studio, our AERMOD software, personalised for your firm. We are based in Indore, Madhya Pradesh and work across India. Talk to our team.