
Dispersion modelling has a blunt truth at its core: the model can only disperse the emissions you give it. If the emission inventory is wrong, every concentration, contour, and conclusion downstream is wrong too. Building a solid inventory is foundational work.
What an emission inventory is
An emission inventory is a structured list of every source at a facility and how much of each pollutant it releases. For dispersion modelling, each source also needs its physical release characteristics.
What each source needs
For every stack or release point:
- Emission rate per pollutant, in the model's required units (often grams per second)
- Stack height and inside diameter
- Exit gas velocity or volumetric flow rate
- Exit gas temperature
- Location coordinates
Area and volume sources (fugitive dust, storage piles, vents) have their own parameter sets.
Where emission rates come from
Emission rates are usually derived from one or more of:
- Stack testing / continuous monitoring — the most reliable, measured directly
- Emission factors — published factors multiplied by an activity rate (e.g. fuel burned)
- Mass balance — calculating emissions from process inputs and outputs
- Design basis / vendor data — expected rates from equipment specifications
Documenting which method was used for each source is part of a defensible inventory.
Common inventory pitfalls
- Unit errors — mixing up per-hour and per-second rates changes everything by a factor of 3,600
- Forgetting sources — fugitive and minor sources left out understate total impact
- Using maximum vs typical rates inconsistently — regulators usually want worst-case, but it must be applied consistently
- Stale factors — outdated emission factors that no longer reflect the process or fuel
Build it to be checked
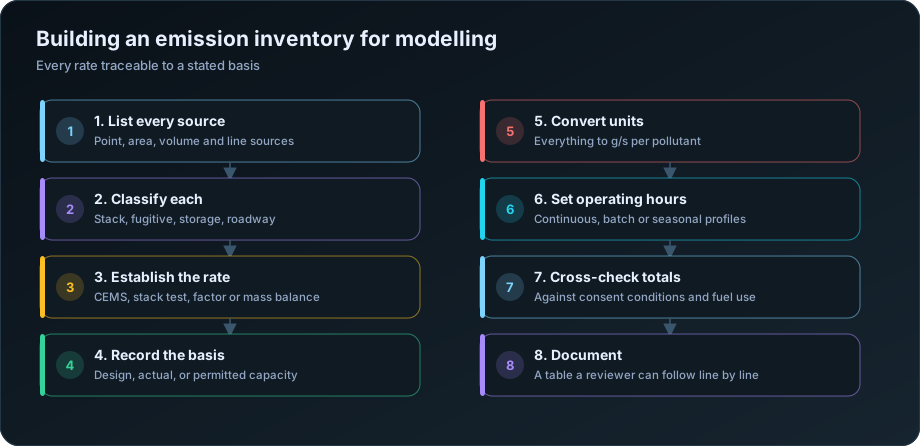
A good inventory is transparent: every number has a source and a method, so a reviewer (or your modelling subcontractor) can verify it. That traceability is what lets the whole study withstand scrutiny.
The handoff
When you commission modelling, the emission inventory is the input only you can provide — the modeller cannot invent your emission rates. Spend the time to get it right and verified, and the modelling that follows becomes fast and reliable. Get it wrong, and no model can save the result.
Source types, and what each one needs
AERMOD represents sources in four geometries, and choosing the wrong one misplaces the release in a way no amount of accurate emission data corrects.
| Source type | Use for | Parameters required |
|---|---|---|
| Point | Stacks and vents | Height, inner diameter, exit velocity, exit temperature, coordinates |
| Area | Storage piles, ponds, open yards, landfill | Release height, area extent, initial vertical dimension |
| Volume | Conveyors, buildings with fugitive leaks, transfer points | Release height, initial lateral and vertical dimensions |
| Line | Haul roads, conveyor corridors | Treated as a series of adjacent volume or area sources |
| Open pit | Quarries and mines below grade | Pit dimensions and depth |
The recurring error is modelling everything as a point source because stack data is what arrives first. A stockpile is not a stack: it releases at low height across a wide area, and it produces its highest concentrations very close by, whereas a tall stack's maximum is a kilometre away. Modelled as a point source, the entire spatial pattern is wrong.
Where emission rates come from, and how much to trust them
| Method | Reliability | When to use it |
|---|---|---|
| Continuous emission monitoring | Highest | Available on large combustion units |
| Stack testing | High | Periodic compliance testing |
| Mass balance | High for specific processes | Sulphur in fuel, solvent usage |
| Manufacturer guarantees | Moderate | New equipment, before commissioning |
| Published emission factors | Moderate to low | Fugitives, and where nothing else exists |
| Engineering estimate | Lowest | Last resort, clearly flagged |
Emission factors — from the US EPA AP-42 compilation or CPCB sources — are indispensable for fugitive sources but carry substantial uncertainty. AP-42 assigns quality ratings from A to E to its factors, and an E-rated factor may be uncertain by a factor of several. Use them where nothing better exists, cite the specific factor and its rating, and state the uncertainty rather than presenting the number as measured.
For fugitive dust, factors depend on parameters that must be site-specific: silt content, moisture, vehicle weight, distance travelled, wind speed. Applying a default factor without those inputs produces a number with the appearance of precision and none of the substance.
The basis question, which must be answered explicitly
The same stack has at least three legitimate emission rates, and the report must state which was used and why.
| Basis | Represents | Appropriate for |
|---|---|---|
| Design or maximum | Full rated capacity, worst case | Regulatory assessment, EC applications |
| Permitted | The consent limit | Compliance demonstration |
| Actual measured | Current operation | Health assessment, current-condition studies |
Regulatory assessments normally require design or permitted rates, because the question is whether the facility could cause an exceedance at full operation. A study using average actual emissions to demonstrate compliance answers a different question, and reviewers treat it accordingly.
For plants with multiple operating modes — different fuels, different loads, seasonal operation — model the worst realistic combination rather than a weighted average. An average of two modes represents neither, and the worst case is what the assessment is for.
Units, and the conversion that goes wrong most
AERMOD expects grams per second. Nothing else in an industrial data pack is in those units.
| Given as | Convert by |
|---|---|
| kg per hour | ÷ 3.6 |
| tonnes per annum | ÷ (operating hours × 3.6) |
| mg/Nm3 | × normal flow rate, then correct to actual conditions |
| lb per hour | × 0.126 |
The mg/Nm3 conversion is the source of most errors. A consent condition of 50 mg/Nm3 is a concentration, not an emission rate. Converting requires the volumetric flow rate at normal conditions — and "normal" itself needs definition, since Indian consent conditions typically reference dry gas at a specified oxygen level and standard temperature and pressure. Using actual stack flow where normal flow was intended, or ignoring the oxygen correction, produces errors of tens of percent.
The tonnes-per-annum conversion carries its own trap: dividing an annual total by 8,760 hours assumes continuous operation. A plant running 6,000 hours a year has a higher hourly rate than that division suggests, and the difference matters for short-term standards.
Fugitive sources, which are often the dominant ones
In cement, mining, aggregate, steel and bulk material handling operations, fugitive PM10 at nearby receptors frequently exceeds stack contributions. Modelling only stacks can predict compliance while omitting the source that actually governs the result.
| Fugitive source | Model as | Key drivers |
|---|---|---|
| Unpaved haul roads | Line or adjacent volume sources | Vehicle weight, silt content, trips per day |
| Material stockpiles | Area source | Pile area, moisture, wind speed |
| Conveyor transfer points | Volume source | Throughput, drop height, enclosure |
| Crushing and screening | Volume or point | Throughput, control efficiency |
| Loading and unloading | Volume source | Tonnes handled, method |
| Wind erosion from open areas | Area source | Exposed area, surface condition |
| Construction activity | Area source | Area disturbed, activity level |
Control efficiencies must be justified rather than assumed. Water spraying on haul roads is commonly credited with 50 to 80% control, but only with a stated application frequency and rate. An uncontrolled emission factor with an unsupported 90% control credit is a finding waiting to happen.
The inventory table a reviewer can follow
| Column | Content |
|---|---|
| Source ID | Consistent with the model input file |
| Description | Plain language: "Kiln main stack" |
| Source type | Point, area, volume or line |
| Coordinates and base elevation | Same projection throughout |
| Stack or geometry parameters | As applicable to the type |
| Pollutant | One row per pollutant |
| Emission rate in g/s | The value entered into the model |
| Original value and units | As supplied |
| Basis | Design, permitted or actual |
| Method | CEMS, stack test, factor with citation |
| Operating hours | Continuous, batch, seasonal |
| Control device and efficiency | With justification |
The test to apply: a reviewer with your table and your source documents should be able to reproduce every g/s figure. If any row requires an unstated assumption, the inventory is incomplete. This is the traceability standard discussed in how to QA/QC an air dispersion modelling report.
For the full input set see the AERMOD input data checklist; for combining sources across facilities, cumulative impact assessment. Our AERMOD air dispersion modelling service builds inventories to this standard. US EPA AP-42 is the primary published source of emission factors.
Frequently Asked Questions
What is an emission inventory for dispersion modelling?
A complete, documented list of every source that emits the pollutants being assessed, with each source's geometry, location, emission rate in grams per second, the basis for that rate, and the method used to establish it.
What units does AERMOD need for emission rates?
Grams per second. Rates given as kg/hour, tonnes per annum or mg/Nm3 must be converted, and the mg/Nm3 conversion additionally requires the normal volumetric flow rate with the correct oxygen and temperature reference.
Should fugitive emissions be included in dispersion modelling?
Yes, and in cement, mining and bulk handling operations they often dominate near-field PM10 concentrations. Haul roads, stockpiles, transfer points and open areas should be modelled as line, area or volume sources with justified control efficiencies.
What is the difference between design and actual emission rates?
Design or maximum rates represent full rated capacity and are what regulatory assessments normally require. Actual measured rates represent current operation and suit health impact or current-condition studies. The report must state which was used.
Where do emission factors come from?
Published compilations, principally US EPA AP-42 and CPCB sources. AP-42 rates its factors from A to E for reliability, and lower-rated factors can be uncertain by a factor of several — cite the specific factor and its rating rather than presenting the result as measured.
How should stockpiles and haul roads be modelled?
Stockpiles as area sources with the pile footprint and a low release height; haul roads as line sources or a series of adjacent volume sources. Modelling them as point sources misplaces the release and produces the wrong spatial pattern entirely.
Need a modelling or EIA data desk without the overhead? DSTechnoverse works as a confidential, white-label subcontractor for air and water dispersion modelling and EIA data analysis. Get in touch to scope your next project.