
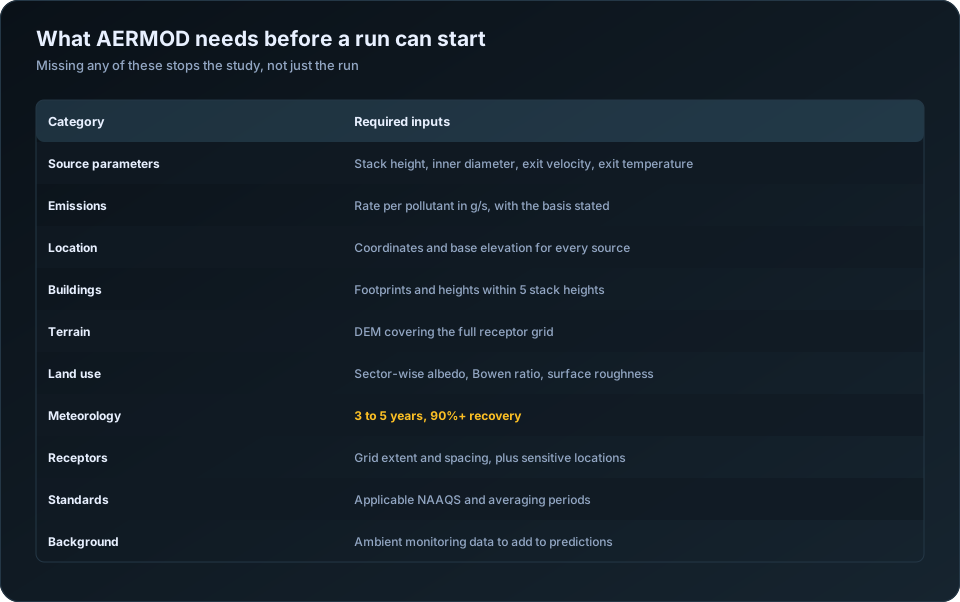
The single biggest cause of slow AERMOD studies is not modelling complexity — it is waiting on inputs. If you are commissioning a modelling subcontractor, handing over a complete data package on day one can shave a week off the timeline. Here is the checklist.
1. Source parameters
For every emission source:
- Source type (point, area, volume, or line)
- Stack height and inside diameter
- Exit gas velocity (or volumetric flow rate)
- Exit gas temperature
- Emission rate per pollutant (with units and basis)
- Exact source coordinates (with the coordinate system stated)
2. Site and layout
- Site boundary and a georeferenced base map or layout drawing
- Building dimensions and locations (needed for downwash / BPIP-PRIME)
- Nearby structures taller than roughly 40% of stack height
3. Pollutants and standards
- List of pollutants to model
- Averaging periods required (1-hour, 8-hour, 24-hour, annual)
- The standards to screen against (NAAQS, WHO, or project-specific)
- Any background concentrations to add
4. Receptors
- Sensitive receptors (schools, hospitals, residences) with coordinates
- Any specific receptor grid resolution the terms of reference require
5. Regulatory context
- The regulator's terms of reference or scoping document
- Any prior modelling or monitoring reports for the site
What your subcontractor supplies
You do not need to provide everything. A good modelling partner will source and process:
- Meteorological data (via AERMET)
- Terrain and elevation data (via AERMAP)
- Land-use and surface roughness characterisation
Why this matters
Every missing item becomes a query, and every query becomes a delay. A source parameter guessed rather than confirmed becomes a risk to the whole study. Sending a complete, verified package up front is the cheapest way to buy speed and confidence.
Keep this checklist as a template. The projects where you fill it in fully before kick-off are the ones that finish on time.
The full checklist, with sources and tolerances
| Input | Where it comes from | Tolerance for error |
|---|---|---|
| Stack height above grade | Design drawings, as-built survey | Low — drives plume rise directly |
| Stack inner diameter | Design drawings | Low — velocity is derived from it |
| Exit gas velocity | Stack test, or flow ÷ area | Low |
| Exit gas temperature | Stack test or design | Low — buoyancy depends on it |
| Emission rate per pollutant | CEMS, stack test, emission factor | Low, and the basis must be stated |
| Source coordinates | GPS survey or site plan | Moderate |
| Base elevation of each source | DEM or survey | Moderate |
| Building footprints and heights | Site plan | Moderate, within 5 stack heights |
| Terrain DEM | SRTM, Cartosat, survey | Moderate |
| Land use for surface characteristics | Satellite imagery, ground truth | Moderate |
| Meteorological data | IMD, airport, on-site tower | Low — see recovery requirements |
| Receptor grid definition | Set by the assessment scope | Moderate |
| Applicable standards | NAAQS and consent conditions | Must be exact |
| Background concentrations | Ambient monitoring | Moderate |
| Operating hours and load profile | Plant operations | Moderate |
The "tolerance" column is worth reading carefully. Stack diameter appears trivial and is not — exit velocity is computed from flow rate and area, so a diameter recorded as 2.0 m when it is 1.8 m changes velocity by 23% and momentum rise with it.
Units: where studies quietly go wrong
Unit errors are the most common category of input mistake, and they rarely announce themselves. The model runs, the output looks reasonable, and the numbers are wrong by an order of magnitude.
| Quantity | AERMOD expects | Commonly supplied as |
|---|---|---|
| Emission rate | grams per second | kg/hour, TPA, mg/Nm3 |
| Stack height | metres above grade | Feet, or above mean sea level |
| Exit velocity | metres per second | m3/hr flow, requiring conversion |
| Exit temperature | kelvin | Degrees Celsius |
| Diameter | metres | Millimetres, or outer rather than inner |
| Coordinates | UTM metres | Latitude and longitude in degrees |
Two conversions cause most of the damage. Concentration to mass rate: a permit stating 50 mg/Nm3 is a concentration, not an emission rate, and converting requires the volumetric flow at normal conditions plus a correction to actual stack conditions. Getting the normal-versus-actual distinction wrong shifts everything downstream. Stack height datum: a drawing giving stack top elevation above mean sea level is not stack height above grade, and confusing them in undulating terrain produces a stack tens of metres taller or shorter than reality.
Build the input table with a units column and a source column, and have someone other than the modeller check it against source documents. This one review catches more real errors than any amount of post-run inspection.
Emission rate basis: design, actual, or permitted
Three different numbers exist for the same stack, and the study must state which was used.
| Basis | What it represents | When it is appropriate |
|---|---|---|
| Design or maximum | Plant at full rated capacity | Worst-case assessment, and usually what regulators expect |
| Permitted | The consent limit | Compliance demonstration against the consent |
| Actual or average | Measured operating emissions | Realistic current impact, health assessments |
Regulatory air quality assessments normally use design or permitted rates, because the question is whether the facility could cause an exceedance, not whether it currently does. A study using actual average emissions to demonstrate compliance answers a different question and will usually be sent back.
For multi-fuel or variable-load plants, run the worst realistic combination rather than an average. An average of two operating modes represents neither.
Receptors: the grid decides what you find
| Zone | Typical spacing |
|---|---|
| Fenceline | 25 to 50 m along the boundary |
| Up to 1 km | 50 to 100 m |
| 1 to 5 km | 100 to 250 m |
| 5 to 10 km | 250 to 500 m |
| Beyond 10 km | 500 m to 1 km |
| Sensitive receptors | Discrete points at exact coordinates |
Two failures recur. A grid too coarse near the source misses the maximum, which for typical industrial stacks often falls between 300 m and 2 km. A grid whose extent is too small pushes the maximum to the domain edge — if your highest concentration sits on the boundary of the grid, the grid is wrong, and the study is incomplete.
Sensitive receptors — schools, hospitals, villages, ecologically protected areas — should be entered as discrete points at their actual coordinates, not approximated to the nearest grid node. Regulators and public hearings look for them specifically.
Terrain elevation must be assigned to every receptor through AERMAP. Flat-terrain runs at a site with real relief are among the more visible errors in a submitted report.
What the subcontractor supplies, and what only you can
If the modelling is outsourced, the split is clear and worth being explicit about. A modelling partner can procure and process met data, prepare terrain and land use, run BPIP-PRIME, configure and execute the model, post-process and map results, and draft the technical report.
What no subcontractor can supply is the plant data: stack dimensions, exit conditions, emission rates and their basis, building layout, operating profile, and the regulatory context the study must satisfy. Delays in outsourced modelling are almost always waiting on this list. Assembling it before engagement is the single largest thing a client can do to compress the timeline — see turnaround time for outsourced AERMOD studies and how to outsource air dispersion modelling.
For meteorological requirements in depth see AERMET explained; for terrain and surface parameters, terrain and land use in AERMOD; for building effects, AERMOD building downwash. Our AERMOD air dispersion modelling service issues this checklist at project start. The CPCB emission standards define the consent limits most Indian studies model against.
Frequently Asked Questions
What input data does AERMOD need?
Stack parameters (height, inner diameter, exit velocity and temperature), emission rates in grams per second with a stated basis, source coordinates and elevations, building dimensions within five stack heights, terrain and land use data, a full year of quality-assured meteorology, a receptor grid, applicable standards and background concentrations.
What units does AERMOD use for emission rates?
Grams per second. Rates supplied as kg/hour, tonnes per annum or mg/Nm3 must be converted, and the mg/Nm3 conversion additionally requires the volumetric flow rate and a correction from normal to actual stack conditions.
Should I model design or actual emission rates?
Design or permitted rates for regulatory assessments, because the question is whether the facility could cause an exceedance at full capacity. Actual measured rates are appropriate for health impact studies or for describing current conditions.
How fine should the AERMOD receptor grid be?
Fifty to one hundred metres within the first kilometre, coarsening to 250 to 500 metres by 10 km. If the maximum concentration falls on the edge of your grid, the grid is too small and must be extended.
How many years of meteorological data are needed?
Five years where available, or one well-justified representative year for smaller assessments. Each year needs at least 90% valid hours, with gaps documented and their distribution across seasons reported.
What data must the client provide for outsourced modelling?
Stack dimensions and exit conditions, emission rates with their basis, source coordinates, building footprints and heights, the site plan, operating profile, and the applicable consent conditions. A subcontractor can supply everything else, but not these.
Need a modelling or EIA data desk without the overhead? DSTechnoverse works as a confidential, white-label subcontractor for air and water dispersion modelling and EIA data analysis. Get in touch to scope your next project.