
Regulators reject air dispersion studies for surprisingly repetitive reasons. After enough reviews, the same mistakes appear again and again. Here are ten to check for before you submit.
1. Unrepresentative meteorological data
Using a met station too far from the site, or in a different terrain regime, undermines the whole study. The meteorology must plausibly represent conditions at the source.
2. Poor met data recovery
Regulators typically expect around 90% valid hours per year. Gappy data invites a rejection or a request to re-run.
3. Wrong surface characteristics
Albedo, Bowen ratio, and roughness that do not match the actual land use produce the wrong turbulence — and the wrong concentrations.
4. Ignoring building downwash
Stacks near buildings need BPIP-PRIME. Skip it and you may badly under-predict ground-level concentrations near the source.
5. A receptor grid that is too coarse
If the grid is too sparse near the source, you can miss the true maximum concentration entirely.
6. Incorrect stack parameters
A transposed exit velocity or temperature quietly changes plume rise and every downstream number. Verify against the design basis.
7. Forgetting background concentrations
Predicted impact must usually be added to existing background before comparison with the standard. Omitting it understates the total.
8. Wrong averaging periods or standards
Comparing a 24-hour prediction against a 1-hour standard — or using an outdated limit — is an easy, fatal slip.
9. Terrain handled incorrectly
Elevated terrain near the source needs proper AERMAP processing. Flat-terrain assumptions in hilly areas are not defensible.
10. An untraceable report
If a reviewer cannot trace every figure back to an input, they cannot trust it. Documentation and reproducibility are part of the deliverable, not an afterthought.
The common thread
Almost every item on this list is an input or QA failure, not a modelling-engine failure. That is good news: a disciplined checklist and an independent review catch nearly all of them before a regulator ever sees the study. It is exactly why a dedicated modelling desk, with QA built into the workflow, produces cleaner submissions.
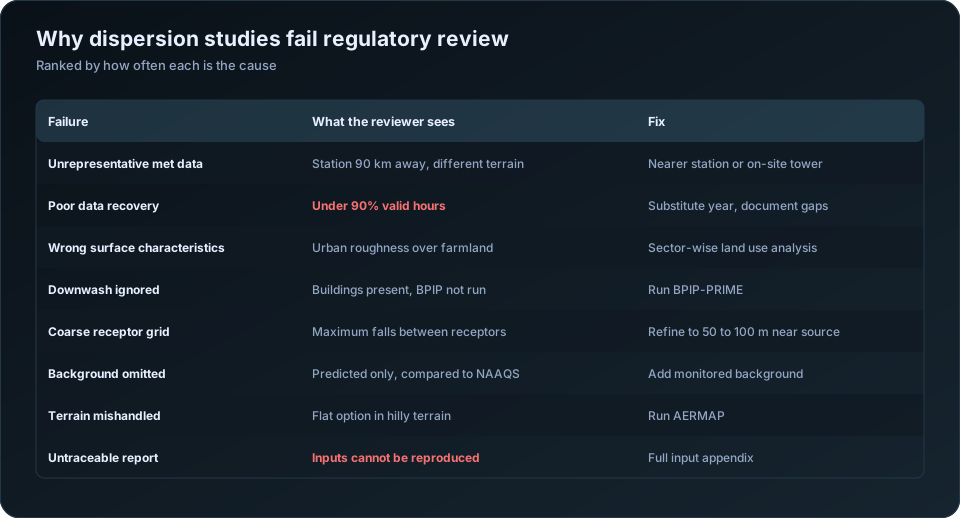
How each mistake is caught, and what it costs
Knowing the ten failures is useful. Knowing what each looks like in a submitted report, and what a reviewer will do about it, is more useful.
| Mistake | What the reviewer sees | Consequence |
|---|---|---|
| Unrepresentative met data | Station 90 km away, across a ridge | Re-run with a different station |
| Poor data recovery | Under 90% valid hours, undocumented | Re-run with another year |
| Wrong surface characteristics | Urban roughness over farmland | Re-run AERMET and AERMOD |
| Downwash ignored | Buildings on the site plan, no BPIP file | Re-run; results usually rise |
| Coarse receptor grid | Maximum at 1 km with 500 m spacing | Refine and re-run |
| Wrong stack parameters | Velocity inconsistent with diameter and flow | Recheck all inputs |
| Background omitted | Predicted values compared directly to NAAQS | Recompute compliance |
| Wrong averaging period | 24-hour standard, annual result presented | Re-post-process |
| Flat terrain assumed | Contours ignore visible relief | Run AERMAP, re-run |
| Untraceable report | Numbers cannot be tied to input files | Rewrite the report |
Notice how many of these require re-running the model. That is the real cost: not the error itself but the four to six weeks a re-run adds to a clearance timeline, usually at the point where the project can least afford it.
The three that regulators catch most often
Ignoring building downwash. If a building sits within about five stack heights and is comparable in height to the stack, the plume can be pulled into its wake and brought to ground far closer and far more concentrated than an undisturbed plume. Skipping BPIP-PRIME is easy — the model runs happily without it — and it is visible to any reviewer who compares the site plan against the input file. Predicted concentrations typically rise when downwash is properly included, sometimes substantially. See AERMOD building downwash.
Omitting background concentrations. AERMOD predicts your source's contribution. NAAQS applies to total ambient concentration. Comparing a predicted 38 ug/m3 against a 100 ug/m3 standard and declaring compliance ignores the 55 ug/m3 already in the air. The correct comparison adds monitored background to predicted increment. In much of industrial India, background alone consumes most of the standard, and this is precisely why the omission matters.
Averaging period mismatches. NAAQS specifies different limits for different periods — 24-hour and annual for PM10, 1-hour and annual for NO2. The model must be post-processed to produce each relevant statistic, in the correct form. For most Indian standards the relevant metric is the value that may be exceeded no more than 2% of the time, which is not the same as the highest predicted value. Presenting the wrong statistic is a common finding and a straightforward one to avoid.
The mistakes specific to Indian assessments
| Mistake | Why it arises here |
|---|---|
| Using a distant IMD station without justification | Sparse station network makes it tempting |
| Upper air data from a very distant sounding | Radiosonde stations are few |
| Ignoring seasonal land use change | Bare soil, irrigated crop and stubble differ enormously |
| Not modelling fugitive and material handling sources | Only stacks get inventoried |
| Omitting neighbouring industry from cumulative assessment | Data is harder to obtain |
| Modelling only PM, ignoring gaseous pollutants in the consent | Consent conditions not read closely |
| Monsoon-period gaps left undocumented | Data loss concentrates in that season |
Fugitive sources deserve emphasis. In cement, mining, aggregate and bulk material handling operations, fugitive dust from stockpiles, conveyors, unpaved roads and loading points often exceeds stack emissions for PM10 at nearby receptors. A study modelling only the stack can predict compliance while the actual dominant source was never entered. See how to prepare an emission inventory.
A self-check before submission
Run through these before the report leaves your desk.
| Check |
|---|
| Every stack parameter traced to a source document, with units verified |
| Emission rate basis stated: design, permitted or actual |
| Met station justified on distance, elevation, terrain and land use |
| Data recovery stated, with gap distribution across seasons |
| Surface characteristics assigned by sector and by season |
| BPIP-PRIME run, or a written justification for why not |
| AERMAP run, or flat terrain justified |
| Receptor grid fine enough near source; maximum not on the domain edge |
| Sensitive receptors entered as discrete points |
| Background concentrations added, with the monitoring source cited |
| Correct statistic for each averaging period |
| Every table in the report reproducible from the input files |
The last line is the standard that matters. Another modeller, given your input files, should be able to reproduce every number in your report. If they cannot, the report is not defensible regardless of whether the modelling was correct. This is the discipline covered in how to QA/QC an air dispersion modelling report.
Why these persist
Almost none of this reflects ignorance of the correct method. The pattern is structural: modelling sits at the end of an EIA timeline, inputs arrive late, and the schedule compresses onto the one task that cannot be hurried without cutting checks.
The practical defence is to front-load. Assemble and verify inputs before starting, run the model early enough that a re-run is survivable, and have someone who did not run the model check the input table against source documents. Independent review is cheap; a re-run six weeks before a public hearing is not.
For input preparation see the AERMOD input data checklist; for reading results correctly, how to read AERMOD output. Our AERMOD air dispersion modelling service applies the checklist above to every study. The US EPA SCRAM modelling guidance documents the regulatory basis for most of these requirements.
Frequently Asked Questions
What is the most common mistake in AERMOD modelling?
Using unrepresentative meteorological data — a station too far away, at a different elevation, or in a different terrain and land use setting. It affects every hour of the assessment and cannot be corrected without re-running the entire study.
Why do dispersion modelling reports get rejected?
Most often for unrepresentative or poorly documented meteorology, omitted building downwash, missing background concentrations, a receptor grid too coarse to capture the maximum, or a report whose numbers cannot be traced back to input files.
Do I need to add background concentrations to AERMOD results?
Yes. AERMOD predicts only your source's contribution, while ambient standards apply to total concentration. Compliance must be assessed against predicted increment plus monitored background, citing the monitoring source and period.
When is building downwash required in AERMOD?
Whenever a structure lies within roughly five stack heights of a source and is of comparable height. BPIP-PRIME should be run and its output included, or the report should explicitly justify why downwash was not considered.
What data recovery is acceptable for AERMOD meteorology?
At least 90% valid hours per modelling year. Lower recovery needs justification, and the distribution of gaps matters — losses concentrated in one season remove a whole meteorological regime from the assessment.
How do I know if my receptor grid is fine enough?
If the maximum predicted concentration falls on the edge of the grid, the domain is too small. If spacing near the source exceeds about 100 metres in the first kilometre, the grid is likely stepping over the true maximum. Refine and re-run to confirm the peak is stable.
Need a modelling or EIA data desk without the overhead? DSTechnoverse works as a confidential, white-label subcontractor for air and water dispersion modelling and EIA data analysis. Get in touch to scope your next project.