
It is tempting to think of a dispersion model as just a source and some wind. But AERMOD is sensitive to the ground — both its shape and its surface. Getting terrain and land use right is often what separates a realistic study from a misleading one.
Terrain: the job of AERMAP
AERMAP is AERMOD's terrain preprocessor. It reads digital elevation data (such as SRTM or DEM tiles) and assigns each receptor an elevation and a hill height scale that tells AERMOD how nearby terrain influences the plume.
Why it matters:
- A plume that would pass harmlessly overhead on flat ground can impact elevated terrain downwind, producing high concentrations on a hillside.
- Ignoring terrain in a hilly area under-predicts those impacts — a classic reason studies get challenged.
For genuinely flat sites, simple terrain handling is fine. For anything with hills, ridges, or valleys near the source, proper AERMAP processing is essential.
Land use: surface roughness and heat exchange
Separately, AERMOD (via AERMET) needs to know what the ground is like, described by three parameters:
- Surface roughness — how much the surface slows and stirs the wind (a forest roughens flow far more than open water)
- Albedo — how much solar radiation the surface reflects
- Bowen ratio — how the surface partitions heat into warming the air versus evaporating moisture
These control how turbulent and how mixed the atmosphere is — which controls how quickly the plume dilutes.
Why these values are not one number
Land use changes with direction and season. The area to the north of a site might be dense forest; to the south, open farmland. So surface parameters are defined by wind-direction sector and often by season, not as a single site-wide value. Careless "one size fits all" values are a common weakness in weaker studies.
The practical implication
Terrain and land use are not box-ticking inputs — they can move predicted concentrations substantially. Sourcing the right elevation data, classifying land use honestly, and defining sector-and-season surface parameters is detailed work. It is also exactly the kind of detail that a modelling specialist handles routinely and that rushed studies skip.
AERMAP: what terrain processing actually produces
AERMAP does two things, and only the second is widely understood.
It assigns an elevation to every receptor and source, which is straightforward. It also computes a critical hill height scale for each receptor — an estimate of the terrain feature that most influences the flow arriving at that point. AERMOD uses this to decide, hour by hour, how the plume behaves relative to the terrain.
The underlying physics is that in stable conditions a plume tends to travel horizontally and impact rising ground, while in unstable conditions it tends to follow the terrain over the top. AERMOD blends these two states using a dividing streamline height derived from the hill height scale. That blending is why terrain in AERMOD is not simply a matter of receptor elevation.
The practical consequence: elevated receptors on hillsides frequently record the highest concentrations in a study, because the plume reaches ground level there while it would still be aloft over flatter ground.
| DEM source | Resolution | Notes |
|---|---|---|
| SRTM | 30 m | Freely available, adequate for most studies |
| Cartosat / CartoDEM | 30 m | Indian source, good coverage |
| ASTER GDEM | 30 m | Alternative global source |
| Survey of India toposheets | Varies | Contour-derived, useful for validation |
| Site survey | Sub-metre | For the immediate plant area |
Thirty-metre DEM data is sufficient for regulatory dispersion assessment. What matters more than resolution is that the DEM covers the entire receptor grid with a margin — AERMAP needs terrain beyond the receptor domain to compute the hill height scale correctly. A DEM clipped exactly to the grid boundary produces incorrect values at the edges.
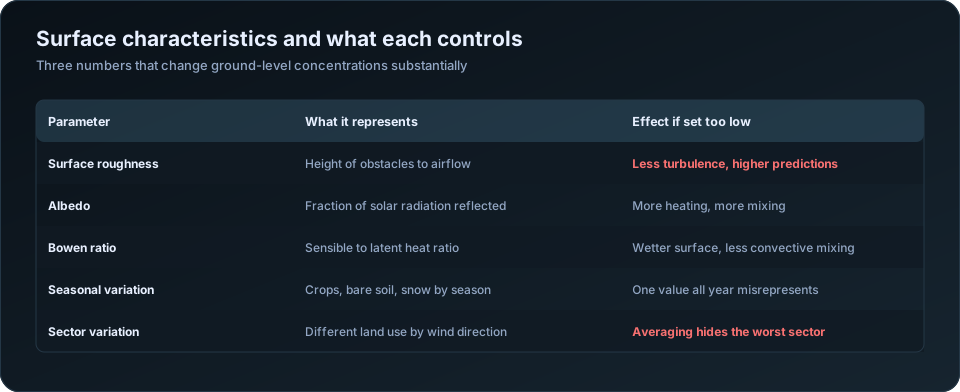
Surface characteristics: three numbers, one big effect
| Parameter | Physical meaning | Effect of setting it too low |
|---|---|---|
| Surface roughness, z0 | Height of obstacles impeding airflow | Less mechanical turbulence, less dispersion, higher predicted concentrations |
| Albedo | Fraction of solar radiation reflected | More surface heating, more convective mixing |
| Bowen ratio | Ratio of sensible to latent heat flux | Wetter surface, less convective mixing |
Typical values:
| Land cover | Roughness (m) | Albedo | Bowen ratio (dry season) |
|---|---|---|---|
| Water | 0.0001 | 0.10 | 0.1 |
| Irrigated cropland | 0.03 to 0.20 | 0.18 | 0.3 to 0.5 |
| Dry cropland or grassland | 0.05 to 0.10 | 0.20 | 2.0 to 4.0 |
| Scrubland | 0.20 | 0.22 | 3.0 to 6.0 |
| Deciduous forest | 0.50 to 1.00 | 0.16 | 0.7 to 2.0 |
| Suburban | 0.50 | 0.16 | 1.0 to 2.0 |
| Dense urban | 1.00 | 0.18 | 1.5 to 2.5 |
Roughness has the most direct effect on results. A site surrounded by farmland assigned urban roughness will disperse the plume more than reality and under-predict concentrations; the reverse over-predicts. Reviewers check this against satellite imagery, and it is one of the easier findings for them to make.
Two rules that are constantly broken
Assign by sector. Land use around a meteorological station is rarely uniform. AERSURFACE divides the surroundings into up to twelve wind-direction sectors, so hours with wind from a forested sector use forest values and hours from a town use urban values. A single averaged value across all directions removes precisely the variation that matters, and can hide the worst-case sector entirely.
Assign by season. The same field is bare soil in May, flooded paddy in August and stubble in December. Bowen ratio swings from around 0.3 under irrigation to 4.0 or more when dry — more than an order of magnitude, on a parameter that directly controls convective mixing. Indian agricultural landscapes make this variation larger than in the temperate settings much of the guidance was written for.
The two rules compound. Twelve sectors across four seasons is 48 parameter sets, which sounds burdensome and is handled by AERSURFACE from a land cover raster in a few minutes.
Radius, and matching characteristics to the right place
| Parameter | Radius of influence around the met station |
|---|---|
| Surface roughness | About 1 km upwind |
| Albedo | About 10 km |
| Bowen ratio | About 10 km |
These differ because the parameters affect different processes. Roughness governs mechanical turbulence generated locally; albedo and Bowen ratio govern the surface energy balance over a broader area.
The most important and most frequently missed point: surface characteristics describe the land around the meteorological station, not around your plant. AERMET uses them to interpret the observations from that station. If your met data comes from an airport 40 km away, the characteristics must describe the airport's surroundings. Using your project site's land use with a distant station's data is a genuine mismatch, and it is a common error.
Where the station and site differ substantially in land cover, that is itself evidence about representativeness, discussed in AERMET explained.
What to document
| Item | Detail to record |
|---|---|
| DEM source and resolution | With the download date and coverage extent |
| Coordinate system | Projection and datum, consistently across all inputs |
| AERMAP domain | Extent, confirmed larger than the receptor grid |
| Land cover source | Satellite imagery, land use map, or ground survey |
| Sector definitions | Number of sectors and their bearings |
| Seasonal definitions | Which months map to which season |
| Parameter values | The full table, by sector and season |
| AERSURFACE version | Or the manual assignment method used |
The coordinate system row causes more real problems than it should. Terrain, sources, buildings and receptors must all be in one projection. Mixing UTM zones, or lat-long with UTM, misplaces sources by kilometres — and the model runs without complaint, producing a plausible-looking result for a plant that is not where you think it is.
For the full input set see the AERMOD input data checklist; for building effects, AERMOD building downwash; for reading the results, how to read AERMOD output. Our AERMOD air dispersion modelling service processes terrain and land use as part of every study. The US EPA AERSURFACE user guide documents the parameter assignment procedure.
Frequently Asked Questions
What does AERMAP do in AERMOD?
It assigns terrain elevation to every source and receptor, and computes a critical hill height scale used by AERMOD to determine how the plume behaves relative to terrain in stable and unstable conditions. It is more than a lookup of receptor elevations.
What DEM resolution does AERMOD need?
Thirty-metre data such as SRTM or CartoDEM is adequate for regulatory assessment. More important than resolution is that the DEM extends beyond the receptor grid, since AERMAP needs surrounding terrain to compute hill height scales correctly.
What is surface roughness in AERMOD?
A length representing the height of obstacles that impede airflow — around 0.03 m for grassland, 0.5 m for forest, 1.0 m for dense urban areas. It controls mechanical turbulence, and setting it too low produces less dispersion and higher predicted concentrations.
Should surface characteristics vary by season and direction?
Yes, on both counts. Land cover differs by wind-direction sector around the station, and changes seasonally — Bowen ratio can vary more than tenfold between irrigated and dry seasons. AERSURFACE handles up to twelve sectors across four seasons automatically.
Do surface characteristics describe my site or the meteorological station?
The meteorological station. AERMET uses them to interpret observations from that station, so they must describe the land around it. Using project site land cover with data from a distant station is a common and consequential error.
Why do elevated receptors often show the highest concentrations?
Because in stable conditions the plume travels roughly horizontally and intercepts rising ground while remaining aloft over flatter terrain. Hillside receptors at plume height therefore experience higher ground-level concentrations than receptors on the plain.
Need a modelling or EIA data desk without the overhead? DSTechnoverse works as a confidential, white-label subcontractor for air and water dispersion modelling and EIA data analysis. Get in touch to scope your next project.