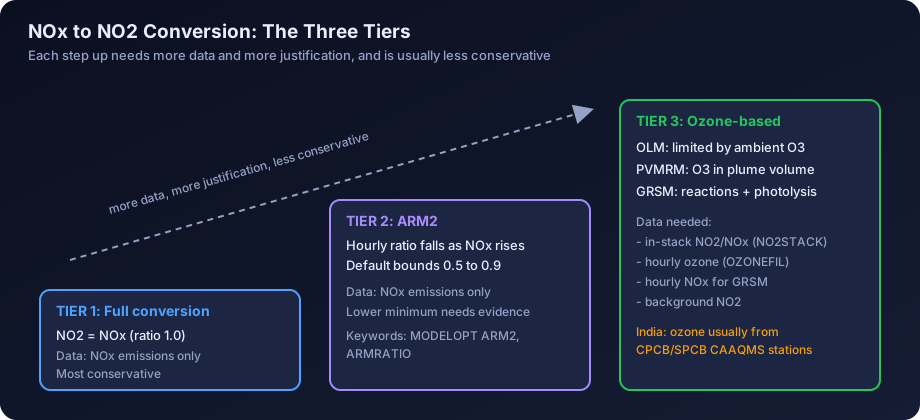
Quick answer: Stacks emit nitrogen oxides (NOx), mostly as nitric oxide (NO), but India's NAAQS 2009 limits are set for nitrogen dioxide (NO2). AERMOD therefore models NOx and then converts it to NO2 using one of the tiered methods in the US EPA Guideline on Air Quality Models (Appendix W): Tier 1 assumes all NOx becomes NO2, Tier 2 (ARM2) applies an empirical ambient ratio, and Tier 3 (OLM, PVMRM or GRSM) limits conversion by the ozone actually available. Start with Tier 1, and move to a higher tier only when you have the in-stack ratio and hourly ozone data to support it.
NO2 is one of the pollutants that most often decides whether a combustion project's air quality chapter reads cleanly or not. Boilers, gas turbines, DG sets, kilns, furnaces and captive power plants all emit NOx, and the 24-hour NO2 standard of 80 µg/m³ is not generous in industrial clusters where the baseline is already elevated. How you convert modelled NOx to NO2 can change the predicted incremental concentration by a large margin, so it is worth getting right and worth explaining clearly in the report.
This guide explains the chemistry in plain terms, walks through each tier in the US EPA framework, sets out what data each method needs, and shows how to choose and document a method for an Indian EIA, Consent to Establish (CTE) or expansion study. It finishes with a worked example, the mistakes we see most often, and a reporting checklist.
Why AERMOD Models NOx but the Standard Is for NO2
Combustion at high temperature fixes atmospheric nitrogen and fuel nitrogen into nitrogen oxides. At the stack exit, the bulk of this NOx is nitric oxide (NO). Only a small fraction, typically somewhere in the range of a few per cent to a few tens of per cent depending on the source type, leaves the stack as NO2. This primary fraction is called the in-stack NO2/NOx ratio.
Once the plume mixes with ambient air, NO reacts with ozone (O3) to form NO2:
- NO + O3 gives NO2 + O2. This is fast, and is limited by how much ozone the plume can entrain.
- In sunlight, NO2 photolyses back to NO and an oxygen atom, which regenerates ozone. This reverse reaction is why NO2/NOx ratios level off at an equilibrium rather than climbing to 100 per cent.
- At night, with no photolysis, the forward reaction dominates, but ozone near the ground is often depleted, so the conversion is again limited.
Ambient standards are written for NO2 because it is the species with respiratory effects. NAAQS 2009 sets NO2 limits of 80 µg/m³ (24-hour) and 40 µg/m³ (annual). India has no 1-hour NO2 standard, unlike the US, where the 1-hour standard drove the development of the refined methods.
AERMOD is a steady-state plume model that disperses a pollutant mass without running full atmospheric chemistry. Combustion NOx is normally inventoried as NOx expressed as NO2, so the model predicts NOx as NO2, and a separate step estimates how much is actually NO2 at each receptor and hour. For deriving NOx rates, see our guide to building an emission inventory for dispersion modelling.
The US EPA Tiered Approach Under Appendix W
The US EPA Guideline on Air Quality Models (Appendix W to 40 CFR Part 51) sets out a three-tier approach for NO2. India has no equivalent guidance, so practitioners and reviewers generally treat Appendix W as the reference, just as AERMOD itself is run with US EPA regulatory defaults. Each step up uses more information, is usually less conservative, and demands more justification.
| Tier | Method | Basic assumption | Main data needed | Typical conservatism |
|---|---|---|---|---|
| 1 | Full conversion | All NOx is NO2 | None beyond NOx emissions | Highest |
| 2 | ARM2 (Ambient Ratio Method 2) | NO2/NOx ratio falls as NOx concentration rises, within a bounded range | None beyond NOx emissions; optional justified bounds | High to moderate |
| 3 | OLM (Ozone Limiting Method) | Conversion limited by available ozone | In-stack NO2/NOx ratio, hourly ozone, background NO2 | Moderate |
| 3 | PVMRM (Plume Volume Molar Ratio Method) | Ozone available in the plume volume limits conversion | As OLM, plus plume-volume calculation inside AERMOD | Moderate to refined |
| 3 | GRSM (Generic Reaction Set Method) | Simplified reaction set including photolysis | In-stack ratio, hourly ozone, hourly background NOx | Refined |
Version matters. The set of regulatory options has evolved over AERMOD releases and Appendix W revisions: ARM2 replaced the older fixed-ratio ARM, OLM and PVMRM moved from non-default to regulatory status, and GRSM was added later as a Tier 3 option. Always state the AERMOD version number in the report and check that the option you used is treated as regulatory in that version.
Tier 1: Full Conversion
Tier 1 assumes all NOx at the receptor is NO2: model NOx as NO2 and report it directly, with no conversion keyword. Tier 1 is always conservative because the real NO2/NOx ratio can never exceed 1. It needs no extra data and cannot be challenged on chemistry, but for large combustion sources it can overstate near-field NO2 several-fold. For many Indian CTE studies, such as a small boiler or a few DG sets, it is all that is needed.
Tier 2: ARM2
ARM2 was developed by the US EPA from a large set of ambient monitoring data. It applies an NO2/NOx ratio to each modelled hourly NOx concentration, with the ratio falling as NOx rises: near sources, high NOx outstrips the ozone available to convert it.
ARM2 bounds this ratio between a default minimum of 0.5 and a default maximum of 0.9. In AERMOD the method is selected with MODELOPT ARM2 on the CO pathway, and the bounds can be changed with the ARMRATIO keyword. Appendix W allows a lower minimum ratio only when it is justified, typically by source-specific in-stack ratio data showing the primary NO2 fraction is low.
ARM2 needs no ozone data and is simple to explain: predicted NO2 is between 50 and 90 per cent of predicted NOx in every hour. Its weakness is that it is empirical, derived from US monitoring networks, and does not respond to local ozone. Because the ratio falls only at high NOx concentrations, ARM2 gives the biggest reduction for the hourly peaks that drive short-term averages; for annual averages the ratio is usually nearer the upper bound.
Tier 3: OLM
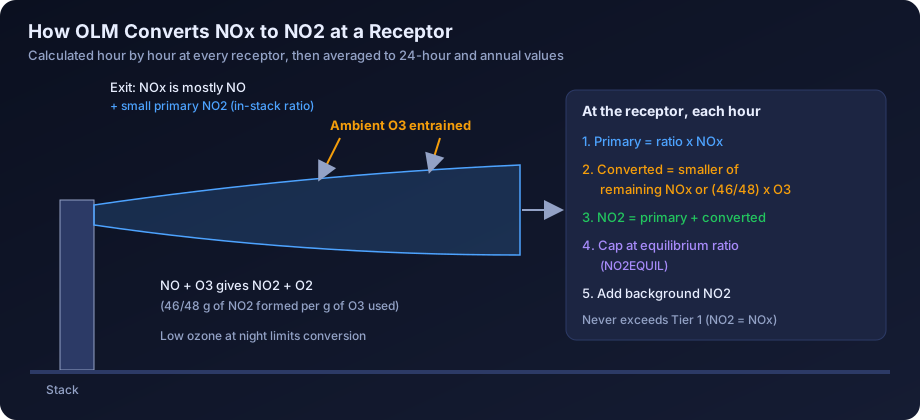
The Ozone Limiting Method assumes that the NO emitted by the source is converted to NO2 only to the extent that ozone is available. For each hour at each receptor, it calculates:
- Primary NO2: the in-stack NO2/NOx ratio multiplied by the modelled NOx.
- Available conversion: the remaining NOx (the NO part), limited by the ambient ozone concentration multiplied by the ratio of molecular weights of NO2 and O3 (46/48) when concentrations are in µg/m³.
- Total source NO2: primary NO2 plus the smaller of the remaining NOx and the ozone-limited amount.
- A cap at the equilibrium NO2/NOx ratio, which reflects the photolysis balance and can be set with the NO2EQUIL keyword.
- Background NO2, added if it is supplied within the model.
In AERMOD, OLM is selected with MODELOPT OLM. In-stack ratios are given per source with the NO2STACK keyword on the SO pathway. Ozone is supplied as a single value with OZONEVAL, as an hourly file with OZONEFIL, or as varying values by season and hour with O3VALUES. OLMGROUP lets nearby sources share the same ozone instead of each getting the full concentration; OLMGROUP ALL is a common conservative choice when plumes overlap.
Tier 3: PVMRM
The Plume Volume Molar Ratio Method refines OLM by estimating how much ozone is actually entrained into the plume. AERMOD calculates the plume volume between the source and the receptor, works out the number of moles of ozone in that volume from the ambient concentration, and compares it with the number of moles of NOx. The ratio of ozone moles to NOx moles sets the conversion, subject to the same in-stack ratio and equilibrium cap.
Because the plume volume grows with distance, PVMRM gives low conversion close to the source and higher conversion further away, which suits isolated tall stacks such as utility boilers and gas turbines. It is selected with MODELOPT PVMRM, needs the same NO2STACK and ozone inputs as OLM, and runs more slowly with many sources and dense grids.
Tier 3: GRSM
The Generic Reaction Set Method uses a simplified reaction set including NO2 photolysis and plume travel time, so it represents gradual conversion with distance and day-night differences. Unlike OLM and PVMRM, GRSM needs hourly background NOx as well as hourly ozone, supplied with the NOXFIL or NOX_VALS keywords, because ambient NOx affects the photostationary balance.
GRSM is selected with MODELOPT GRSM. It is the most data-demanding option and the least familiar to Indian reviewers, and is worth considering only when co-located hourly ozone and NOx data exist, which in India usually means a representative CAAQMS station.
What Each Method Needs
If you cannot supply a tier's inputs defensibly, do not use that tier.
| Input | Tier 1 | ARM2 | OLM | PVMRM | GRSM |
|---|---|---|---|---|---|
| NOx emission rate (as NO2) per source | Yes | Yes | Yes | Yes | Yes |
| In-stack NO2/NOx ratio (NO2STACK) | No | Only to justify a lower minimum ratio | Yes | Yes | Yes |
| Hourly ozone (OZONEFIL) or representative values (OZONEVAL, O3VALUES) | No | No | Yes | Yes | Yes |
| Hourly background NOx (NOXFIL or NOX_VALS) | No | No | No | No | Yes |
| Source grouping for ozone competition | No | No | OLMGROUP | Internal | Internal |
Background NO2 for the cumulative result is needed in every tier, added either outside the model or with the BACKGRND keyword.
In-Stack NO2/NOx Ratios
The in-stack ratio is one of the most influential inputs in OLM, PVMRM and GRSM, and the one most often assumed without support. Sources of defensible values, in order of preference:
- Source-specific stack testing that measures NO and NO2 separately (not just total NOx). Many Indian stack monitoring reports give NOx only, so check the method used. Our guide to stack emission monitoring data analysis covers how to read these reports critically.
- Manufacturer test data for the same equipment model, fuel and load.
- Published compilations of in-stack ratios by source category, such as the in-stack ratio database maintained by the US EPA, used with care for matching fuel and combustion technology.
- A conservative default. US guidance accepts a default in-stack ratio where source data are lacking; if you rely on a default, state it and its basis explicitly.
Different source types behave very differently. Diesel engines, particularly with oxidation catalysts, can have relatively high primary NO2 fractions, while large coal-fired and gas-fired boilers are usually at the low end. Using a single low ratio for a mixed set of sources that includes DG sets is a common error.
Background Ozone
Ozone should represent the air the plume mixes with, not a traffic-titrated urban core. Hourly data are strongly preferred because ozone has a strong diurnal cycle; a single average applied to every hour under-converts in the afternoon and over-converts at night. AERMOD uses the OZONEVAL value for missing hours, so choose it conservatively, for example a high percentile rather than the mean.
Background NO2
Indian EIA reports usually add baseline NO2 to the increment outside the model, which is transparent. If background is supplied inside AERMOD with BACKGRND, do not add it again in the summary table. Our guide to cumulative air quality impact assessment in India covers how to treat other existing and proposed sources in the area.
Where Ozone Data Comes From in India
This is the practical bottleneck for Tier 3 in India. The options, from most to least preferred, are:
| Source | What it provides | Strengths | Watch-outs |
|---|---|---|---|
| CPCB/SPCB Continuous Ambient Air Quality Monitoring Stations (CAAQMS) | Hourly or 15-minute O3, NO, NO2, NOx and other pollutants | Continuous, multi-year, publicly accessible through the CPCB data portal | Most stations are urban; data gaps and calibration flags need screening; distance from site |
| Project baseline monitoring | O3 sampled as part of NAAQS parameters during the baseline season | Site-specific | Usually one season, often 8-hourly or 24-hourly samples, not a continuous hourly series |
| Industry-operated continuous analysers | Hourly O3 at plant or township stations | Close to site | Quality assurance varies; check calibration records |
To use CAAQMS data well:
- Pick the nearest station representative of the project airshed, avoiding stations dominated by traffic, whose low night-time ozone understates conversion.
- Use the same calendar period as your meteorological data.
- Screen for negative values, flat-lined periods and implausible spikes. Document the percentage of valid hours.
- Convert units consistently. AERMOD accepts ozone in ppb or µg/m³ through the OZONUNIT setting; CAAQMS ozone is usually reported in µg/m³.
- Fill gaps with a stated, conservative method and keep a record of which hours were filled.
- Check the timestamp convention (hour-beginning versus hour-ending) and the time zone. AERMOD meteorology and CAAQMS data must line up hour by hour.
For the meteorological side, see our guide to meteorological data for air modelling in India and our article on AERMET meteorological data preprocessing.
If you only have one season of baseline ozone sampled at a few fixed hours, that is not enough for an hourly OZONEFIL. You could use O3VALUES to supply seasonal or diurnal profiles derived from a representative CAAQMS station, scaled or checked against your baseline samples, but explain why the profile is representative. Where no credible ozone data exist, stay at Tier 1 or ARM2.
How to Choose a Method for Indian EIA and CTE Studies
Indian rules do not specify a tier, so the choice is a professional judgement that the State Expert Appraisal Committee (SEAC), the Expert Appraisal Committee (EAC) or the SPCB reviewer must be able to follow. A practical decision sequence:
- Run Tier 1 first. Report the maximum 24-hour and annual NOx as NO2, add the appropriate baseline, and compare with NAAQS.
- If Tier 1 complies with a comfortable margin, stop. Tier 1 is the easiest result to defend, and most small and medium CTE applications end here.
- If Tier 1 is close to or above the standard, check the inputs before the chemistry. Overstated emissions, wrong stack parameters or mis-added background cause more apparent exceedances than conservative chemistry. Our list of common AERMOD mistakes is a good checklist.
- Move to ARM2 if inputs are confirmed. It needs no extra data and is well documented in Appendix W. Report both Tier 1 and ARM2 results side by side.
- Move to OLM or PVMRM only with real data. You need a defensible in-stack ratio for every NOx source and representative hourly ozone for the modelled period. OLM is usually the right choice for clusters of sources at one site (with OLMGROUP), PVMRM for a few large, isolated stacks.
- Consider GRSM only with co-located hourly ozone and NOx and a reviewer who has seen it before, or be prepared to explain it in detail.
- Never use a refined method to hide a real problem. If the project only complies under the most refined chemistry with assumed inputs, the better route is often engineering: low-NOx burners, flue gas recirculation, SCR or SNCR, a taller stack within CPCB stack height norms, or a revised layout.
Source type also matters. The air dispersion modelling for thermal power plants context, with tall stacks, large NOx loads and NOx emission limits that CPCB has set by unit vintage, is where Tier 2 and Tier 3 methods are most often worth the effort. Cement kilns, glass furnaces and refinery heaters are similar. DG sets, small boilers and process heaters at a typical MSME site rarely need anything beyond Tier 1.
CPCB's industry-specific emission standards, and the conditions SPCBs write into CTE and CTO orders, set NOx limits in mg/Nm³ or as ppmv corrected to a reference oxygen level, depending on the sector and equipment. Model a rate consistent with that limit or the design guarantee, corrected to actual flue gas conditions, because reviewers check it against the consent.
Worked Example: One Hour, Then the 24-Hour Result
The numbers below are illustrative only. They are chosen to show the arithmetic, not to represent any real project.
A gas-fired boiler stack has an in-stack NO2/NOx ratio of 0.10, from manufacturer data. At a receptor 1.2 km downwind, AERMOD predicts the following hourly NOx (as NO2) concentrations for three hours on the day of the maximum 24-hour result, with representative ozone from a CAAQMS station:
| Hour (illustrative) | Modelled NOx (µg/m³) | Ambient O3 (µg/m³) | Primary NO2 = 0.10 × NOx | Remaining NOx | Ozone-limited conversion = (46/48) × O3 | OLM NO2 = primary + smaller of the two |
|---|---|---|---|---|---|---|
| 03:00 | 60 | 10 | 6.0 | 54.0 | 9.6 | 15.6 |
| 11:00 | 60 | 40 | 6.0 | 54.0 | 38.3 | 44.3 |
| 15:00 | 30 | 90 | 3.0 | 27.0 | 86.3 | 30.0 (limited by NOx) |
In the 15:00 row the ozone is more than sufficient, so all the NOx would be converted and the equilibrium cap then applies. With an equilibrium ratio of 0.9 for this illustration, the cap is 0.9 × 30 = 27.0 µg/m³, so the OLM result for that hour is 27.0 rather than 30.0.
Now the comparison for the maximum 24-hour average at the same receptor, again illustrative:
| Method | Predicted 24-h NO2 increment (µg/m³) | Illustrative baseline 24-h NO2 (µg/m³) | Resultant (µg/m³) | NAAQS 24-h (µg/m³) |
|---|---|---|---|---|
| Tier 1 full conversion | 22.0 | 38.0 | 60.0 | 80 |
| Tier 2 ARM2 (default bounds) | 15.5 | 38.0 | 53.5 | 80 |
| Tier 3 OLM (in-stack 0.10, hourly O3) | 12.8 | 38.0 | 50.8 | 80 |
In this example the project complies under Tier 1, so the honest conclusion is to report Tier 1 and note that refined methods would give lower values. If the baseline were 62 µg/m³ instead of 38, Tier 1 would give 84 µg/m³ and ARM2 would give 77.5 µg/m³. That is the scenario where a properly documented ARM2 or OLM result becomes worthwhile, and also where the reviewer will look hardest at every input.
Note that the annual average responds differently. Annual NOx is built from thousands of hours, most at low concentrations with moderate ozone, so the conversion fraction for the annual average is usually higher than for the short-term peak. Do not apply the short-term reduction percentage to the annual result.
Common Mistakes in NO2 Modelling
- Reporting NOx as "NO2" without saying so. If you used Tier 1, say so explicitly. Unlabelled results invite questions about whether conversion was done at all.
- Applying a fixed ratio by hand to the final output. Multiplying the maximum 24-hour NOx by an assumed ratio after the run is not ARM2 and is not OLM. AERMOD applies the conversion hour by hour before averaging; post-processing the averaged result loses that.
- Assuming an in-stack ratio without evidence. A low in-stack ratio applied to diesel engines, or a single ratio for all sources regardless of type, will be challenged.
- Using urban ozone that is titrated by traffic. Low night-time ozone at a roadside station understates conversion for a rural or semi-rural site.
- Mismatched periods. Ozone from one year and meteorology from another, or hourly files that are offset by one hour, silently corrupt the result.
- Ignoring overlapping plumes in OLM. Running each source with the full ambient ozone available to it overstates the ozone supply when plumes overlap. Use OLMGROUP where appropriate.
- Adding background twice. Supplying background NO2 inside AERMOD and then adding baseline again in the report table.
- Applying US 1-hour logic in India. India has no 1-hour NO2 standard; the compliance metrics are the 24-hour and annual averages.
- Not comparing refined and Tier 1 runs receptor by receptor. A refined result should never exceed full conversion at any receptor. If it does, look for a units problem, a background double count or a misplaced keyword.
Many of these are input problems rather than chemistry problems. Our AERMOD input data checklist helps catch them before the run, and our guide to QA/QC of an air dispersion report helps catch them after.
How to Report NO2 Conversion
A clear NO2 section in the air quality chapter of an EIA or CTE report should include:
| Item | What to state |
|---|---|
| Model and version | AERMOD version number, AERMET version, regulatory default options |
| Pollutant basis | NOx emission rates expressed as NO2, source by source |
| Conversion method | Tier and method (Full conversion, ARM2, OLM, PVMRM, GRSM) and the reason for choosing it |
| In-stack ratios | Value per source and its basis (stack test with NO and NO2 measured, manufacturer data, published compilation or default) |
| Ozone data | Station name, operator, distance and direction from site, period, data capture, gap-filling method, units |
| Background NO2 and NOx | Source of baseline data, statistic used, whether added inside or outside AERMOD |
| Equilibrium ratio and grouping | NO2EQUIL value if changed; OLMGROUP definition if used |
| Results | Maximum 24-hour and annual NO2 increment, location of maxima, values at sensitive receptors and monitoring stations |
| Comparison | Tier 1 result alongside any refined result, so the reviewer sees the effect of the method |
| Cumulative assessment | Increment plus baseline compared with NAAQS 2009 |
Showing the Tier 1 result next to the refined result is the single most useful thing you can do to build reviewer confidence. It shows that the method was chosen deliberately and that the conclusion does not depend on a hidden assumption. Our guide to air dispersion modelling report contents explains how the rest of the modelling chapter should be laid out, and air quality modelling for environmental clearance covers how the ToR wording usually frames the modelling requirement.
Regulatory Context in India
Under the EIA Notification 2006, ToR issued by the EAC or SEAC usually require predicted incremental GLCs for PM10, PM2.5, SO2 and NOx using an approved model, compared cumulatively with NAAQS. The ToR often says "NOx" while the standard is for NO2; the conversion method fills that gap, and the report should say so. SPCB CTE reviews follow the same logic on a smaller scale. No CPCB guidance prescribes ARM2, OLM or PVMRM, so a transparent explanation is the best protection. See NAAQS standards in India explained for how each parameter is defined.
How DSTechnoverse Helps
We set up NO2 modelling the way reviewers expect to see it: a Tier 1 run first, and then a documented ARM2 or Tier 3 run only when the inputs support it. Our AERMOD modelling service covers emission inventory checks, in-stack ratio review, screening and alignment of CAAQMS ozone data, and report-ready tables for EIA and CTE studies, including white-label work for EIA consultancies. If you run models in-house, AERMOD Studio runs the real US EPA AERMOD in the browser for point sources. To discuss a project, talk to our team.
Frequently Asked Questions
Does AERMOD predict NO2 directly? AERMOD disperses the NOx mass you give it and, unless a conversion option is selected, reports NOx as NO2. Conversion to NO2 is applied hour by hour through the selected method: full conversion, ARM2, OLM, PVMRM or GRSM. The report should state which method was used so that the reviewer knows whether the NO2 figure is a conservative upper bound or a refined estimate based on chemistry and ozone data.
Is Tier 1 full conversion acceptable for an Indian EIA? Yes. Tier 1 is the most conservative option and is widely accepted because it cannot understate NO2. If the project complies with the 24-hour and annual NO2 standards of NAAQS 2009 under Tier 1, there is usually no reason to use a more refined method. Refinement is worth considering only when Tier 1 shows an exceedance or a very small margin after inputs have been checked.
What are the default ARM2 ratio limits? ARM2 bounds the hourly NO2/NOx ratio between a default minimum of 0.5 and a default maximum of 0.9, with the ratio falling as modelled NOx concentration rises. The bounds can be changed with the ARMRATIO keyword, but a lower minimum should only be used with evidence, typically source-specific in-stack ratio data that shows the primary NO2 fraction is low.
What is the in-stack NO2/NOx ratio and where do I get it? It is the fraction of NOx that leaves the stack already as NO2. The best source is a stack test that measures NO and NO2 separately; next best are manufacturer data for the same equipment and fuel, then published compilations by source type. Many Indian stack monitoring reports give only total NOx, which is not enough to establish the ratio.
Can I use one season of baseline ozone for OLM? Not directly as an hourly file, because baseline sampling usually covers a few fixed periods per week rather than every hour. OLM, PVMRM and GRSM need ozone for every modelled hour. You can use representative CAAQMS data for the meteorological period, possibly with seasonal or diurnal profiles, and use the baseline samples as a cross-check. Explain the choice in the report.
Which is better for India, OLM or PVMRM? Neither is better in every case. OLM is simpler, transparent and handles clusters of nearby sources well when combined with OLMGROUP. PVMRM accounts for plume volume, which suits a few large, isolated stacks such as utility boilers. Both need a defensible in-stack ratio and representative hourly ozone. Choose the one that fits the source configuration and the data you can support.
Does India have a 1-hour NO2 standard? No. NAAQS 2009 sets NO2 limits of 80 µg/m³ for the 24-hour average and 40 µg/m³ for the annual average. The US 1-hour NO2 standard and its specific design value form are what drove much of the development of OLM, PVMRM and GRSM, but Indian compliance is judged on the 24-hour and annual averages.
What should I do if the project only complies under GRSM or PVMRM? Check every input first: emission rates against consent limits, stack parameters, receptor placement and background treatment. If the refined result is sound and well documented, present it alongside Tier 1. If compliance depends on assumed rather than measured inputs, consider emission controls or design changes, because a result that hangs on one weak assumption is unlikely to survive appraisal.
Need an AERMOD study or AERMOD software? DSTechnoverse runs regulatory AERMOD modelling studies for EC, CTE and expansion applications, for industries and as a white-label partner for EIA consultancies, and provides AERMOD Studio, our AERMOD software, personalised for your firm. We are based in Indore, Madhya Pradesh and work across India. Talk to our team.