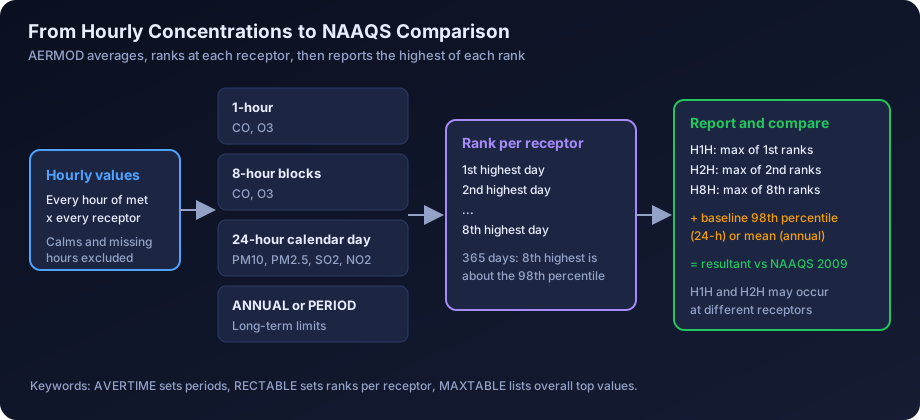
Quick answer: AERMOD calculates a concentration for every hour of meteorology at every receptor, then builds 1-hour, 8-hour, 24-hour and annual (or period) averages from those hours and ranks them, reporting values such as the highest (H1H) and highest second-highest (H2H). Indian NAAQS 2009 24-hour and 8-hour limits apply at the 98th percentile of a year, while annual limits apply to the mean, so the model statistic you report and the baseline statistic you add must match the form of the standard. The most common error is adding the highest modelled value anywhere to the highest baseline value anywhere, which mixes locations and statistics and overstates the result.
Most AERMOD questions in Indian EIA and Consent to Establish (CTE) appraisals are not about the dispersion physics. They are about numbers in the summary table: which average, which rank, which receptor, which baseline value, and whether the sum is a fair comparison with the National Ambient Air Quality Standards. Getting these right is what makes a modelling chapter easy to approve, and getting them wrong is what generates queries.
This guide explains how AERMOD builds each averaging period, what H1H and H2H really mean, how the 98 per cent compliance rule in NAAQS 2009 relates to model output, how to add background properly, and how to present maximum ground level concentrations alongside receptor-specific results. It includes a worked example table with illustrative numbers and a short guide to what reviewers check.
How AERMOD Builds Averaging Periods
AERMOD's basic unit is the hour. For each hour in the meteorological file, it calculates the concentration at every receptor from every source. Everything else is built from those hourly values.
You choose the averaging periods with the AVERTIME keyword on the CO pathway. Options include 1, 2, 3, 4, 6, 8, 12 and 24 hours, MONTH, PERIOD and ANNUAL. Typical Indian runs request 1 and 8 hours for CO, 24 hours for PM10, PM2.5, SO2 and NO2, and ANNUAL or PERIOD for the long-term limits.
| Averaging period | How AERMOD forms it | Indian NAAQS 2009 parameters using it |
|---|---|---|
| 1-hour | Each hourly value directly | CO (4 mg/m³), O3 (180 µg/m³) |
| 8-hour | Average of hours within fixed, non-overlapping 8-hour blocks of each day | CO (2 mg/m³), O3 (100 µg/m³) |
| 24-hour | Average of the hours of each calendar day, midnight to midnight | PM10, PM2.5, SO2, NO2, NH3, Pb |
| PERIOD | Average of all hours in the meteorological file | Used where met data cover less than a year |
| ANNUAL | Average of each complete year; for multi-year runs, the average of the annual means | PM10, PM2.5, SO2, NO2, NH3, Pb, benzene, BaP, As, Ni |
Three details matter in practice.
- Block averages, not running averages. AERMOD's short-term averages are calculated over fixed blocks within each day. A 24-hour value is a calendar-day average, not a rolling 24-hour window. This matches the way 24-hour ambient samples are usually taken in Indian baseline monitoring.
- Calms and missing hours. Under regulatory defaults, hours with calm winds or missing meteorology are excluded from the calculation, and short-term averages are computed using the EPA calm processing rule, which divides by the number of valid hours or by 75 per cent of the averaging period, whichever is greater. This prevents a day with many calm hours from producing an artificially inflated average. A meteorological file with many missing hours will weaken your averages, which is one reason data capture should be reported.
- PERIOD versus ANNUAL. ANNUAL is only meaningful for complete years. If your meteorological data cover one season, AERMOD gives a PERIOD average for that season, which is not an annual mean. We discuss this further below.
Units follow the emission units. With emissions in g/s, AERMOD reports concentrations in µg/m³. CO NAAQS values are in mg/m³, so divide by 1,000 before comparing.
For how the hourly meteorology feeding these averages is prepared, see our guide to meteorological data for air modelling in India.
Highest, Second-Highest and Other Ranks
Once AERMOD has, say, 365 daily averages at each receptor, it needs to summarise them. It does this by ranking the values at each receptor, then reporting the maximum of each rank across receptors.
| Term | Meaning |
|---|---|
| H1H (highest high) | At each receptor, take the highest value of that averaging period. Report the highest of these across all receptors. This is the peak value anywhere on the grid over the whole period. |
| H2H (highest second-high) | At each receptor, take the second-highest value. Report the highest of these across all receptors. |
| HnH (highest nth-high) | The same idea for the nth rank, for example H8H for the eighth-highest. |
| Maximum value table | The overall top values regardless of receptor, from the MAXTABLE keyword. Several entries may be at the same receptor. |
| Rank per receptor table | The ranked values at every receptor, from the RECTABLE keyword. |
Two points cause confusion.
First, H1H and H2H do not have to occur at the same receptor. The receptor with the single worst day may not be the receptor with the worst second day. So the H2H is not simply "the second line of the maximum value table". The maximum value table can list the top values with several at one receptor; the H2H is the receptor-by-receptor second-highest.
Second, the rank refers to the number of averaging periods, not days per se. For 24-hour averages over one year, the eighth-highest at a receptor is the eighth worst day there. For 1-hour averages, the eighth-highest is the eighth worst hour, which is a very different statistic.
The US uses specific ranks tied to its standards (for example, the high-second-high for some short-term limits, or the multi-year average of a given percentile for others). Those forms are written into US rules, and they do not transfer automatically to India. Indian practice is driven by the wording of NAAQS 2009.
How Indian NAAQS 98th-Percentile Compliance Relates to Model Output
NAAQS 2009 states that annual values are the arithmetic mean of measurements taken over a year, and that 24-hourly or 8-hourly or 1-hourly values should be met 98 per cent of the time in a year. Up to 2 per cent of the time they may exceed, but not on two consecutive days of monitoring.
Translated into model statistics:
| Standard form | Monitoring meaning | Closest model statistic |
|---|---|---|
| 24-hour, met 98% of the time | The 98th percentile of a year of daily values must not exceed the limit | With 365 modelled days, 2 per cent is about 7 days, so the 8th-highest daily value at a receptor approximates the 98th percentile |
| 8-hour or 1-hour, met 98% of the time | The 98th percentile of the year's 8-hour or 1-hour values | A much higher rank: for 1-hour values over a year, 2 per cent is about 175 hours |
| Annual mean | Arithmetic mean of the year | ANNUAL average at the receptor |
So in principle, the model statistic that matches a 24-hour NAAQS is something like the H8H for a one-year run. In practice, most Indian EIA reports present the H1H, the absolute maximum, for short-term averages. There are good reasons for this:
- It is conservative and simple, and a reviewer cannot argue that it understates impact.
- The 98 per cent rule includes the condition that exceedances must not occur on consecutive days. A ranked value alone does not show whether that condition is met.
- Many Indian studies use only one season of meteorology. With about 90 days, 2 per cent is under two days, so the 98th percentile is close to the second-highest value and the difference from H1H is small.
If you do report a percentile-equivalent statistic (H2H for a season, or H8H for a year), state the reasoning clearly, request the ranks you need through RECTABLE, and still show the H1H in the same table. A reviewer who sees both can judge the conservatism. If the H1H complies, there is no need to argue about ranks at all.
For a refresher on each NAAQS parameter and how monitoring compliance is judged, see NAAQS standards in India explained, and for the monitoring side of compliance statements, see air quality compliance reporting against NAAQS.
Adding Background: Which Baseline Statistic to Use
The cumulative concentration compared with NAAQS is the predicted increment from the project plus the existing background. In Indian EIA studies, background usually comes from the baseline monitoring programme: typically one season, at a set of stations within the study area, with 24-hour samples taken twice a week, which gives roughly two dozen samples per station per parameter. Reports normally tabulate the minimum, maximum, mean and 98th percentile for each station.
The question is which of these numbers to add to which model output.
| Model output | Baseline statistic to add | Reasoning |
|---|---|---|
| 24-hour increment at a monitoring station receptor | 98th percentile of 24-hour baseline at that station | Matches the 98 per cent form of the 24-hour standard |
| 24-hour maximum GLC on the grid | 98th percentile of the station nearest the maximum, or of the most representative station; or the highest station 98th percentile as a conservative screen | Pairs the increment with a background from the same area |
| Annual or period increment | Mean of the baseline at the relevant station | Matches the arithmetic-mean form of the annual standard |
| 8-hour CO increment | 98th percentile of 8-hour CO baseline | Same logic for the 8-hour limit |
With only around 24 samples per station, the 98th percentile is in practice at or very near the maximum value for that station. That is fine. The point is not that the 98th percentile is much lower than the maximum; the point is to use the right statistic for the standard and the right location for the receptor.
The Maxima-on-Maxima Error
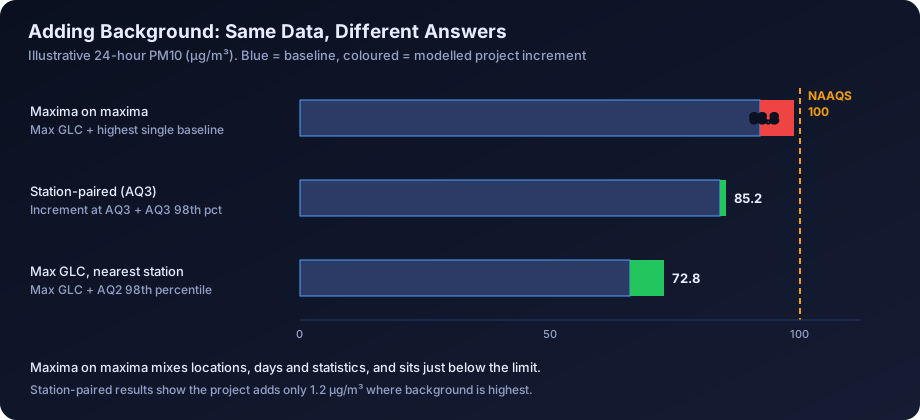
The most common error in Indian reports is to take the single highest predicted 24-hour GLC anywhere on the grid and add it to the single highest 24-hour baseline value from any station, then compare the sum with NAAQS.
This is wrong for three reasons:
- Location mismatch. The maximum GLC might be 1.5 km east of the plant while the highest baseline was recorded 6 km west, near a highway. These two values never coincide at one place.
- Time mismatch. The worst modelled day is driven by specific meteorology, while the worst baseline day reflects local activity, dust events or traffic on a different day. Adding two extremes from different days assumes they happen together.
- Statistic mismatch. Adding a 24-hour maximum to a 24-hour maximum gives a value that is more extreme than the 98th percentile form of the standard.
The result can show a false exceedance, especially for PM10 and PM2.5 in areas where background is already high. It also makes it hard to see the project's real contribution.
That said, maxima-on-maxima is sometimes used deliberately as a first screen: if even the double-maximum sum is below NAAQS, the project clearly complies and no further refinement is needed. If you use it that way, call it a screening check and present the station-paired results as the main assessment.
Better Practice: Station-Paired Results
The approach that reviewers find easiest to follow is:
- Place a discrete receptor at each baseline monitoring station, using the station coordinates from the monitoring report.
- Extract the predicted 24-hour increment (H1H, or the stated rank) and the annual or period increment at each station receptor.
- Add the station's own 98th percentile 24-hour baseline (or mean for the annual comparison).
- Compare each resultant with NAAQS.
- Separately, report the maximum GLC on the grid, its location (distance and direction from the main stack), and a resultant using the nearest or most representative station's baseline.
Our guide to receptor grid design for dispersion modelling explains how to combine Cartesian or polar grids with discrete receptors at monitoring stations and sensitive locations.
Receptor-Level Results Versus Maximum GLC Reporting
These two forms of reporting answer different questions, and a good report gives both.
| Reporting form | Question it answers | What to include |
|---|---|---|
| Maximum GLC | What is the worst-case impact of the project anywhere? | Value, averaging period, rank, coordinates, distance and direction from the source, land use at that point |
| Receptor-level results | What will people and sensitive locations actually experience? | Values at each monitoring station, village, school, hospital, protected area and site boundary point |
| Contours (isopleths) | How is the impact distributed? | Contour plot with scale, north arrow, sources, stations and sensitive receptors marked |
Maximum GLC tells the reviewer whether the project's own increment is significant. Receptor-level results tell the reviewer whether the cumulative concentration complies where it matters. If the maximum falls inside the plant boundary or on uninhabited land, say so, because the compliance question is mainly about ambient air at locations where the public has access, and reviewers will look for that context.
For guidance on presenting the spatial results and contour maps, see reading AERMOD output and contour maps. For why maximum GLC distance varies with stack height and meteorology, see stack height and ground level concentration.
Multi-Year Meteorology
US regulatory practice uses five years of representative airport meteorology or at least one year of site-specific data. In India, the common situations are:
- One season of site-specific data, collected during the baseline monitoring period, combined with upper air data for AERMET.
- One full year built from a combination of on-site data, nearby surface station records and upper air data, or from processed reanalysis sources where justified.
- Several years of surface data, increasingly rare now that some international surface datasets used in the past have become harder to obtain. Our note on NOAA ISD data for AERMOD in 2025 explains the change.
If you do run several years:
- Report H1H across all years for the short-term results. That is the most conservative statement.
- If you report a ranked statistic, be clear whether it is ranked over the whole multi-year record or within each year. The 8th-highest over five years is not the same as the 8th-highest in each year.
- The ANNUAL result in a multi-year run is the average of the annual means. Also check the highest single-year annual mean, because the Indian annual standard is assessed for a year, and the worst year matters.
- Note any years with low data capture.
For seasonal runs, state clearly that the results are for the season modelled, and discuss whether other seasons (especially winter, with more stable conditions and lower mixing heights in much of north and central India) might produce higher short-term concentrations.
Incremental Versus Cumulative Results
These terms are used loosely, so define them in the report.
| Term | What it contains | Compared with |
|---|---|---|
| Incremental (project) concentration | Predicted GLC from the proposed project or expansion sources only | Significance thresholds where used, and for showing the project's share |
| Net incremental (expansion) | Proposed minus existing units being replaced, where the existing units are reflected in baseline | Used for expansions with decommissioning |
| Cumulative (resultant) concentration | Baseline plus project increment, plus other proposed sources not yet reflected in baseline where required | NAAQS 2009 |
For expansions, the existing plant is usually already reflected in the baseline monitoring. Adding the modelled contribution of existing units on top of baseline counts them twice. Model only the new or modified sources, unless the ToR asks for a full-plant run, and explain the treatment. Where other industries are proposed in the same area, the ToR may require them to be included as well; our guide to cumulative air quality impact assessment in India covers this.
Annual Averages From a Single Season
This is a frequent weak point. If you model one season of meteorology, AERMOD gives a PERIOD average for that season. Some reports label it "annual" and compare it with the annual NAAQS. That is not strictly valid, for two reasons:
- Meteorological bias. A pre-monsoon season with strong winds and a deep mixed layer will give a lower period average than a winter season with frequent stable nights. One season does not represent the annual distribution of wind directions either, so the location of the annual maximum can shift.
- Baseline bias. The baseline mean from one season is also not an annual mean, particularly for PM, which in many Indian regions is much higher in winter than in the monsoon.
Practical options:
- Prefer a full year of meteorology for annual averages where it can be assembled credibly.
- If only one season is available, label the result "period average for the monitoring season" and compare it with the annual standard as an indicative check, with a clear statement of the limitation.
- If the seasonal comparison is close to the annual standard, do not rely on it; obtain longer meteorology or present a sensitivity run.
Worked Example: A Compliance Table Built Correctly
The example below is illustrative only. Numbers are chosen to show the method and do not represent any real project.
A new process stack emits PM10. AERMOD is run with one year of meteorology, AVERTIME 24 and ANNUAL, and discrete receptors at four baseline stations. The baseline programme gave 24 samples per station.
| Location (illustrative) | Distance and direction from stack | Predicted 24-h PM10, H1H (µg/m³) | Baseline 24-h PM10, 98th percentile (µg/m³) | Resultant 24-h (µg/m³) | NAAQS 24-h (µg/m³) | Predicted annual PM10 (µg/m³) | Baseline mean (µg/m³) | Resultant annual (µg/m³) | NAAQS annual (µg/m³) |
|---|---|---|---|---|---|---|---|---|---|
| AQ1 Project site | 0.3 km N | 2.1 | 71.0 | 73.1 | 100 | 0.4 | 52.0 | 52.4 | 60 |
| AQ2 Village A | 1.8 km NE | 4.6 | 66.0 | 70.6 | 100 | 0.9 | 47.0 | 47.9 | 60 |
| AQ3 Village B | 3.5 km SW | 1.2 | 84.0 | 85.2 | 100 | 0.2 | 55.0 | 55.2 | 60 |
| AQ4 School | 2.6 km E | 3.0 | 62.0 | 65.0 | 100 | 0.6 | 44.0 | 44.6 | 60 |
| Maximum GLC | 1.4 km NE | 6.8 | 66.0 (AQ2, nearest) | 72.8 | 100 | 1.3 | 47.0 (AQ2) | 48.3 | 60 |
Now compare with the maxima-on-maxima approach for the same illustrative data:
| Approach | 24-h calculation | Result (µg/m³) |
|---|---|---|
| Maxima-on-maxima | Maximum GLC 6.8 + highest single baseline value across all stations (say 92.0, a one-off value at AQ3) | 98.8 |
| Station-paired | Highest station resultant (AQ3: 1.2 + 84.0) | 85.2 |
| Maximum GLC with nearest station background | 6.8 + 66.0 | 72.8 |
All three approaches show compliance in this illustration, but the maxima-on-maxima result sits just under the limit and would look like a near-exceedance in the report, even though the project's actual contribution at AQ3 is only 1.2 µg/m³. Had the one-off baseline value been slightly higher, the report would have shown a false exceedance. The station-paired table shows clearly that the cumulative concentration is driven by existing background at AQ3, not by the project.
A good summary sentence for this example would be: the maximum predicted 24-hour PM10 increment is 6.8 µg/m³ at 1.4 km NE of the stack; the highest cumulative 24-hour concentration at any monitoring location is 85.2 µg/m³ at AQ3, of which the project contributes 1.2 µg/m³; all cumulative values are within NAAQS 2009.
How Regulators Review Averaging and Compliance Tables
Under the EIA Notification 2006, the ToR issued by the EAC or SEAC normally asks for incremental GLC predictions using an approved model, with isopleths and a cumulative comparison against NAAQS. SPCBs reviewing CTE applications look for the same core content on a smaller scale. In appraisal, reviewers typically check:
- That the averaging period matches the standard. 24-hour for PM10, PM2.5, SO2 and NO2; annual for the long-term limits; 1-hour and 8-hour for CO.
- That the rank is stated. If the table says "maximum", is it H1H? If it says something else, why?
- That baseline statistics are stated and appropriate. The 98th percentile for short-term comparisons and the mean for annual comparisons, with the station named.
- That locations are paired. Increment and baseline from the same place, or a clear explanation of the pairing for the maximum GLC.
- That the meteorological period is stated. Season, dates and data capture; whether the annual comparison is a true annual average.
- That the emission rates match the consent or design limits. CPCB industry-specific standards and SPCB consent conditions set emission limits for each sector; modelled rates should be consistent with those limits rather than with lower typical operating values.
- That sensitive receptors are covered. Villages, schools, hospitals and protected areas within the study area.
- That isopleths are consistent with the tables. The contour maximum and the tabulated maximum should agree.
Reports that meet these checks usually draw few queries on the air quality chapter. For a full list of what the modelling chapter should contain, see air dispersion modelling report contents. For a pre-submission check, our guide to QA/QC of an air dispersion report is a useful companion, and common AERMOD mistakes lists the errors that most often lead to resubmission.
A Practical Checklist for Your Results Section
- List the AVERTIME settings and confirm they cover every NAAQS averaging period for the pollutants modelled.
- Request RECTABLE ranks that include the H1H and any percentile-equivalent rank you intend to discuss.
- Use MAXTABLE to identify the top values and check where they occur.
- Place discrete receptors at every baseline monitoring station and sensitive location.
- Tabulate increments at each station, with the station's 98th percentile (short-term) and mean (annual) baseline.
- Report the maximum GLC with its coordinates, distance and direction.
- State whether the annual figure is a true annual average or a seasonal period average.
- Convert units for CO to mg/m³ before comparing.
- Present a summary sentence that separates the project's contribution from the background.
- Cross-check the tables against the contour plots.
How DSTechnoverse Helps
We prepare AERMOD results the way appraisal committees read them: correct averaging periods, clearly stated ranks, discrete receptors at every monitoring station, and baseline added by location and statistic rather than maxima on maxima. Our AERMOD modelling service delivers report-ready compliance tables and isopleths for EIA, CTE and expansion studies, including white-label support for EIA consultancies. Teams who prefer to run their own models can use AERMOD Studio, which runs the real US EPA AERMOD in the browser for point sources. To discuss a study, talk to our team.
Frequently Asked Questions
What is the difference between H1H and H2H in AERMOD? H1H is the highest value of a given averaging period found at any receptor over the modelled period. H2H is found by taking the second-highest value at each receptor and reporting the largest of those across all receptors. The two may occur at different receptors. H1H is the most conservative statistic and is what most Indian EIA reports present for short-term averages.
Which AERMOD value should I compare with the 24-hour NAAQS? The 24-hour NAAQS must be met 98 per cent of the time, so the closest model equivalent for a one-year run is about the eighth-highest daily value at each receptor. Most Indian reports use the H1H instead because it is conservative and simple. If you use a ranked statistic, explain why and show the H1H alongside it.
Which baseline value should be added to the modelled increment? For 24-hour comparisons, add the 98th percentile of 24-hour baseline values at the relevant station. For annual comparisons, add the mean. Pair the increment and the baseline by location: the increment predicted at a monitoring station receptor should be added to that station's own baseline, not to the highest value recorded anywhere in the study area.
Why is adding maximum GLC to maximum baseline wrong? The two maxima usually occur at different places and on different days, so adding them describes a situation that never happens. It also uses a more extreme statistic than the 98 per cent form of the standard. It can be used as a screening check, because a pass is clearly a pass, but it should not be presented as the main compliance assessment.
Can I compare a seasonal AERMOD run with the annual NAAQS? Only as an indicative check. A one-season run gives a period average for that season, which can be higher or lower than a true annual mean depending on the meteorology. Label it clearly as a seasonal period average, explain the limitation, and use a full year of meteorology where the comparison is close to the annual standard.
Does AERMOD use rolling 24-hour averages? No. AERMOD calculates short-term averages over fixed blocks, so 24-hour values are calendar-day averages from midnight to midnight, and 8-hour values are fixed blocks within each day. This aligns with the way 24-hour ambient samples are usually collected in Indian baseline monitoring programmes.
Should I include existing plant emissions in an expansion model? Usually not, if the existing plant was operating during baseline monitoring, because its effect is already in the baseline. Model the new or modified sources and add baseline. If existing units are being shut down, a net calculation may be appropriate. If the ToR asks for a whole-plant run, follow it and explain how double counting with baseline is avoided.
How should multi-year meteorology results be reported? Report the highest short-term value across all years as the H1H, and say whether any ranked statistic is over the whole record or within each year. For annual averages, AERMOD's ANNUAL output for a multi-year run is the average of the annual means; also check and report the worst individual year, since the Indian annual standard applies to a year.
What do reviewers look for in the compliance table? They check that averaging periods match the standards, the rank and baseline statistic are stated, increments and baselines are paired by location, the meteorological period is given, modelled emission rates are consistent with consent or design limits, sensitive receptors are covered and contour plots agree with the tabulated maxima.
Need an AERMOD study or AERMOD software? DSTechnoverse runs regulatory AERMOD modelling studies for EC, CTE and expansion applications, for industries and as a white-label partner for EIA consultancies, and provides AERMOD Studio, our AERMOD software, personalised for your firm. We are based in Indore, Madhya Pradesh and work across India. Talk to our team.