
Quick answer: In India, a socio-economic household survey typically costs ₹800 to ₹1,800 per completed household interview in rural plains, and more in remote or hill areas. That puts a 300-household single-block survey at about ₹3 to ₹6 lakh, a 600-household EIA study at about ₹6 to ₹7 lakh including focus groups, and a 1,000-household district baseline at about ₹8 to ₹18 lakh, before GST.
"What will the survey cost?" is one of the first questions clients ask — and the honest answer is "it depends." Socio-economic and household survey costs vary enormously with the choices you make. Here is what drives the budget and how to plan for it.
The main cost drivers
1. Sample size
The biggest single driver. More completed interviews means more enumerator time, travel, and supervision. Cost scales roughly with the number of interviews — so a ±3% margin (which needs far more households than ±5%) costs substantially more.
2. Geographic spread
- Concentrated samples are cheaper — teams work efficiently in one area
- Dispersed or remote samples cost more — travel, accommodation, and time balloon
- Difficult terrain and poor connectivity add further cost
3. Questionnaire length
A longer questionnaire means longer interviews, fewer completed per day, and higher fatigue-related quality risk — all of which raise cost per interview.
4. Data collection method
- CAPI (tablets) has upfront device/software cost but saves on data entry and rework
- Paper is cheaper upfront but adds data-entry cost and error correction
- CATI (phone) is often cheapest per interview where coverage allows
5. Quality-control intensity
Back-checks, supervision, audio audits, and high-frequency monitoring all add cost — but they are what make the data trustworthy. Cutting them is a false economy.
6. Analysis and reporting
From basic tabulation to advanced analysis and a polished report, the depth of analysis affects the budget.
7. Other factors
- Translation into multiple languages
- Enumerator training time
- Pilot testing
- Incentives for respondents, where used
How to think about your budget
Rather than chasing the lowest quote, ask what quality your decision requires. A cheap survey with weak sampling and no quality control can cost far more in the long run — every wrong decision built on bad data. The right question is value, not just price.
Getting an accurate quote
To get a realistic estimate, be ready to specify:
- Target sample size and population
- Geographic coverage
- Approximate questionnaire length
- Preferred method and languages
- Required analysis and deliverables
The more precisely you scope it, the more accurate — and comparable — the quotes you receive.
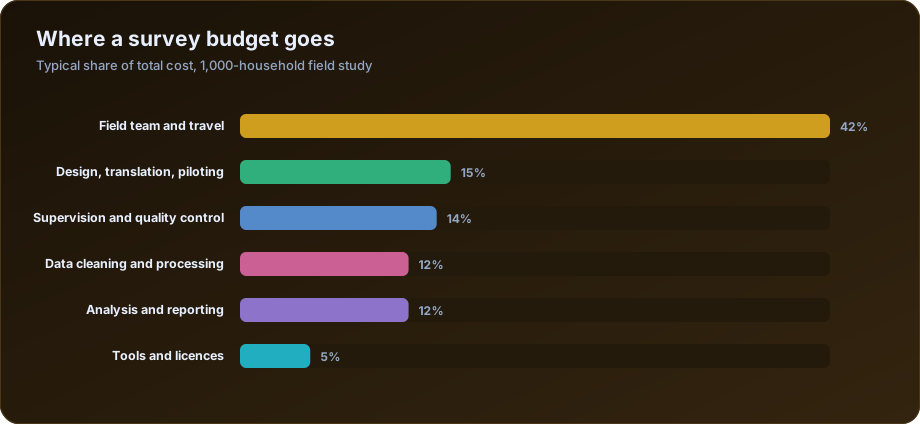
The line items, and what each one covers
A quote presented as a single number is impossible to evaluate. Broken into components, both parties can see what is being bought.
| Line item | Share of budget | What it covers |
|---|---|---|
| Field team and travel | 40 to 45% | Enumerator days, supervisor days, transport, lodging |
| Design, translation, piloting | 12 to 18% | Instrument development, translation, back-translation, pilot round |
| Supervision and quality control | 12 to 16% | Back-checks, audio audits, daily monitoring, revisits |
| Data cleaning and processing | 10 to 14% | Validation, cleaning log, codebook, weights |
| Analysis and reporting | 10 to 15% | Indicator tables, maps, interpretation, drafts |
| Tools and licences | 3 to 6% | Tablets, CAPI platform, SIM data, software |
Two of these are where cheap quotes make their savings. Supervision and quality control is invisible in the deliverable and easy to omit, and it is precisely what separates a dataset you can defend from a spreadsheet of unverifiable claims. Cleaning is the other — a quote that ends at "raw data delivered" has moved 10 to 14% of the work onto you.
What actually drives the number
The instinct is that sample size drives cost. It matters, but three other factors move the total more.
| Driver | Effect on cost |
|---|---|
| Geographic spread | The largest single driver — 40 villages across three blocks costs far more than 40 in one |
| Interview length | A 75-minute questionnaire yields 4 to 5 interviews a day; a 30-minute one yields 10 to 12 |
| Number of languages | Each adds translation, back-translation, piloting and enumerator recruitment |
| Sample size | Roughly linear, but with real economies of scale |
| Terrain and access | Hill, forest and riverine areas can double field days |
| Respondent availability | Populations only reachable in the evening halve daily output |
| Listing requirement | If no household frame exists, listing is a separate exercise |
| Quality intensity | Back-checks, audio audits and revisits add 12 to 16% |
| Season | Monsoon and harvest periods slow everything |
The spread effect surprises most commissioners. Doubling the sample within the same villages adds enumerator days and little else. Keeping the sample but spreading it across three times as many villages adds travel, lodging, supervision, more field teams and more elapsed days.
If your budget is fixed and you want more precision, the efficient move is usually to concentrate geography rather than cut sample — bearing in mind the design-effect trade-off described in sampling methods for household surveys.
Indicative totals
| Study | Households | Indicative range (INR) |
|---|---|---|
| Single-block descriptive survey | 300 | 3,00,000 to 6,00,000 |
| District baseline | 1,000 | 8,00,000 to 18,00,000 |
| District baseline with impact evaluation design | 1,800 across two arms | 16,00,000 to 30,00,000 |
| Multi-district study | 2,500 | 20,00,000 to 45,00,000 |
| Multi-state flagship programme | 5,000+ | 45,00,000 to 1,20,00,000 |
| Endline round, panel tracked | Same as baseline | 70 to 90% of baseline cost |
An endline typically costs slightly less than its baseline because the instrument, translation, training materials and sampling frame already exist. It costs more than people expect because tracking scattered households is labour-intensive — budget for it rather than assuming the endline is simply cheaper.
Cost per Household by Survey Type
Per-interview cost is the easiest figure to compare between agencies, as long as both quotes include the same things. These ranges are for a completed interview including field work, supervision, quality control, cleaning and basic tabulation, before GST.
| Survey setting | Typical cost per completed interview (INR) | Why |
|---|---|---|
| Phone survey (CATI) with an existing contact list | 250 to 600 | No travel; limited to short questionnaires and respondents with phones |
| Urban face-to-face, compact area | 600 to 1,500 | Short travel, but more refusals, gated housing and evening-only availability |
| Rural plains, villages close together | 800 to 1,500 | The most common setting for EIA and CSR baselines |
| Rural, dispersed or poor road access | 1,200 to 2,200 | More travel days and lodging per completed interview |
| Hill, forest, tribal or riverine areas | 1,500 to 3,000 | Slow access, local language enumerators, seasonal constraints |
| Long instruments (over 60 minutes) with anthropometry or water testing | 2,000 to 4,000 | Fewer interviews per day and extra equipment or specialist staff |
If two quotes differ by more than these ranges suggest, the cheaper one has usually left something out: back-checks, revisit attempts, translation, cleaning or the analysis itself.
Worked Example: A 600-Household Survey for an EIA
This illustrative budget is for a socio-economic survey of 600 households in 12 villages within 10 km of a proposed industrial plant in Madhya Pradesh. The questionnaire takes 45 minutes in Hindi, data is collected on tablets, 10% of households are back-checked, and the study adds 6 focus group discussions and 10 key informant interviews. The output is the socio-economic chapter of the EIA report.
| Line item | Basis | Amount (INR) |
|---|---|---|
| Enumerators | 6 enumerators, about 8 interviews a day, roughly 13 field days each | 90,000 |
| Supervisor | 1 supervisor for 15 days | 30,000 |
| Vehicle | 15 days | 45,000 |
| Lodging and food | 7 people, 14 nights | 78,000 |
| Questionnaire design, translation, CAPI programming and pilot | Fixed | 60,000 to 80,000 |
| Quality control | 60 back-checks, audio audits, daily data checks | 45,000 |
| Data cleaning and processing | Cleaning log, codebook, final dataset | 40,000 |
| Focus groups and key informant interviews | 6 FGDs and 10 KIIs, with notes and translation | 1,10,000 |
| Analysis and report | Indicator tables, village profiles, maps, EIA chapter, one revision | 80,000 to 1,20,000 |
| Tablets, software, data | Project share | 20,000 |
| Total before GST | about 6 to 6.6 lakh |
That works out to roughly ₹1,000 to ₹1,100 per household overall, or about ₹850 per household for the quantitative survey alone. GST at 18% is added to the invoice.
Three changes would move this budget the most. Spreading the same 600 households over 30 villages instead of 12 would add about a third to the field cost. Cutting the questionnaire to 30 minutes would save roughly a quarter of enumerator days. Dropping the qualitative work would save about ₹1.1 lakh, but most EIA reviewers expect community consultation evidence, so it is rarely a good saving.
Cost by Purpose of the Survey
The purpose sets the minimum standard, and the standard sets the cost.
EIA socio-economic studies. The Terms of Reference for an EIA normally ask for a socio-economic profile of the study area, often 10 km around the project. Many studies combine Census and secondary data with a primary household survey of a few hundred households and community consultations. Budgets commonly fall between ₹3 lakh and ₹10 lakh depending on the study area and the number of villages. See socio-economic surveys in EIA.
Social Impact Assessment for land acquisition. Under the Right to Fair Compensation and Transparency in Land Acquisition, Rehabilitation and Resettlement Act, 2013, acquisition by the government requires a Social Impact Assessment, including a census of affected families, public hearings and a Social Impact Management Plan. A full census of affected households, legal requirements and hearings make these more expensive per household than a sample survey.
CSR baselines and impact assessments. Under the CSR Rules, companies with an average CSR obligation of ₹10 crore or more over the preceding three years must commission an independent impact assessment for projects with outlays of ₹1 crore or more, once the project has been completed for at least a year. The cost can be booked as CSR expenditure, up to 2% of that year's CSR spend or ₹50 lakh, whichever is less. A baseline at the start makes the later impact assessment far more credible and often cheaper. See baseline surveys for CSR projects.
Programme impact evaluations. Studies with treatment and comparison groups need larger samples and a matched endline, so they sit at the top of the range. See baseline and endline surveys for impact evaluation.
Market, MSME and customer surveys. Usually shorter questionnaires in urban or semi-urban areas, often mixed with phone interviews, and the cheapest per interview.
Qualitative Components: What They Cost
Many socio-economic studies combine a household survey with qualitative methods. They are priced per unit:
| Component | Typical cost per unit (INR) | Includes |
|---|---|---|
| Focus group discussion (FGD) | 10,000 to 20,000 | Mobilisation, trained moderator and note-taker, recording, transcript and translation |
| Key informant interview (KII) | 3,000 to 8,000 | Scheduling, interview, notes or transcript |
| Participatory exercise (resource mapping, seasonal calendar) | 8,000 to 15,000 per village | Facilitator, materials, photographs and write-up |
| Village or facility profile | 2,000 to 5,000 per village | Structured checklist with sarpanch, school, health centre |
| Public consultation support | Quoted per event | Notices, venue, attendance records, minutes |
Qualitative work is cheap relative to its value. Five well-run FGDs often explain the patterns in the household data better than another 200 interviews would.
How Long a Socio-Economic Survey Takes
Time is also a cost, especially when the survey is on the critical path of an EIA or a funding decision.
| Stage | Typical duration |
|---|---|
| Inception, sampling design and questionnaire | 1 to 2 weeks |
| Translation, CAPI programming and pilot | 1 week |
| Enumerator recruitment and training | 3 to 5 days |
| Field work | 2 to 4 weeks for 300 to 1,000 households |
| Cleaning and processing | 1 week, overlapping with field work |
| Analysis and draft report | 2 to 3 weeks |
| Revisions and final report | 1 week |
A typical 600-household study takes 7 to 10 weeks from approval to final report. Rushing it usually means skipping the pilot or training, which are the two steps that protect data quality. Avoid scheduling field work during the monsoon or the main harvest, when roads close and respondents are in the fields.
Hidden Costs to Check
Some costs do not appear in a first quote but turn up later as change orders:
- Household listing where no up-to-date list exists for sampling
- Extra revisits when respondents are away, especially for panel endlines
- Additional languages discovered during the pilot
- Permissions and local coordination, such as meetings with the gram panchayat or district administration
- GPS coordinates and maps for each household or village
- Data protection. Under India's Digital Personal Data Protection Act, 2023, personal data must be collected with informed consent and stored securely; ask how the agency handles names, phone numbers and photographs
- Additional report revisions beyond the one or two included
A good quote states what is included and the rate for each extra, so there are no surprises.
Red Flags in a Survey Quote
- A single lump-sum figure with no breakdown
- No mention of back-checks or a back-check percentage below 5%
- Enumerators paid per interview with no quality checks, which rewards speed over accuracy
- No pilot round in the timeline
- "Data delivered in Excel" with no cleaning log or codebook
- A field period too short for the sample: 1,000 households in one week needs a very large team
- No named field supervisor or project lead
Sample Size, Precision and Cost
Sample size is where precision is bought, and the price rises faster than the precision. For a simple random sample estimating a proportion (for example, the share of households with a toilet) at 95% confidence, the classic sample sizes are:
| Margin of error | Households needed (simple random sample) | With a design effect of 1.5 (cluster sampling) | Indicative field and analysis cost at ₹1,000 per household |
|---|---|---|---|
| ±10% | 96 | about 145 | about ₹1.5 lakh |
| ±7% | 196 | about 295 | about ₹3 lakh |
| ±5% | 384 | about 575 | about ₹5.8 lakh |
| ±4% | 600 | about 900 | about ₹9 lakh |
| ±3% | 1,067 | about 1,600 | about ₹16 lakh |
Halving the margin of error from ±10% to ±5% needs four times the sample, and going from ±5% to ±3% nearly triples it again. Most village-cluster surveys also have a design effect above 1, because households in the same village are similar, so the real sample is larger than the textbook figure. If results are needed separately for subgroups, such as each block or men and women, each subgroup needs its own adequate sample, which multiplies the total.
The practical question is what precision the decision needs. An EIA socio-economic profile rarely needs ±3%; an impact evaluation measuring a five-point change may need more than that. Our guide on household survey sample size covers the calculation in detail.
Comparing Three Quotes: A Worked Example
Suppose three agencies quote for the same 600-household survey:
| Agency A | Agency B | Agency C | |
|---|---|---|---|
| Total quoted | ₹3.9 lakh | ₹6.2 lakh | ₹9.5 lakh |
| Interviews per enumerator per day assumed | 14 | 8 | 7 |
| Back-check rate | Not stated | 10% | 15% with audio audits |
| Pilot | No | Yes | Yes, two rounds |
| Cleaning and codebook | Raw data only | Included | Included |
| Report | Tables only | Tables and EIA chapter | Full report, dashboard and two revisions |
| Enumerator pay | Per interview | Per day | Per day |
Agency A looks cheapest, but 14 interviews a day on a 45-minute questionnaire is not realistic without shortcuts. With no stated back-checks, per-interview pay and raw data only, the client takes on the quality risk and the cleaning work. Agency C is thorough but includes a dashboard and extra rounds the study may not need. Agency B matches the specification. Before choosing on price, the commissioner should ask Agency A how it reaches 14 interviews a day and ask Agency C to price the study without the dashboard. The useful comparison is cost per verified interview, not cost per interview.
How to Write a Survey Brief That Gets Accurate Quotes
A one-page brief saves weeks of back-and-forth and makes quotes comparable. Include:
- Purpose and use. What decision or report the data feeds into, such as an EIA chapter, a CSR baseline or a programme evaluation.
- Population and geography. Districts, blocks or villages, and a map or list if available.
- Sample. Target number of households or respondents, or the precision you need so the agency can calculate it.
- Topics. The main indicators, or a draft questionnaire with its expected length.
- Languages. All languages and dialects in the study area.
- Mode. Face-to-face on tablets, phone, or mixed.
- Qualitative work. Number of FGDs, KIIs or consultations.
- Quality requirements. Back-check percentage, audio audits, supervision ratio.
- Deliverables. Clean dataset with codebook, tables, report, maps, presentation.
- Timeline. Field window and final deadline, and any dates fixed by a regulator or funder.
Send the same brief to every agency and ask each one to answer in the six-line budget format. Our socio-economic and baseline survey team will turn a short brief into a fixed, itemised quote.
In-House Team or Survey Agency?
Organisations with field staff, such as NGOs or CSR foundations, sometimes ask whether they can run the survey themselves. It can be cheaper on paper, but the real comparison includes costs that do not appear in a budget line.
| In-house team | Specialist agency | |
|---|---|---|
| Cash cost | Lower: staff already on payroll | Higher: full cost quoted |
| Staff time | Field staff diverted from programme work for weeks | None beyond reviews |
| Independence | Weak: programme staff surveying their own beneficiaries | Strong, and often required for CSR impact assessments |
| Sampling and instrument design | Needs in-house statistical skills | Included |
| Tools and quality control | Must be set up from scratch | Already in place |
| Credibility with regulators and funders | Often questioned | Generally accepted |
A common middle route is to use your own staff for mobilisation and community introductions while an independent agency designs the study, runs the interviews and analyses the data. That keeps costs down without compromising independence.
Payment Terms and Milestones
Survey contracts in India are usually paid in three or four milestones tied to deliverables rather than dates:
- On signing or inception report: 20% to 30%, covering design, translation and mobilisation.
- On completion of field work: 30% to 40%, once the agreed number of interviews has passed quality checks.
- On draft report and clean dataset: 20% to 30%.
- On final report: the balance, typically 10% to 20%.
Linking the field payment to verified interviews rather than submitted ones protects you and rewards agencies that run proper back-checks. Agree in the contract how many replacement interviews the agency must do at its own cost if back-checks find problems.
Where to cut, and where not to
When the budget will not stretch, some reductions cost you little and others quietly destroy the study.
| Safe to reduce | Do not reduce |
|---|---|
| Number of indicators — cut to what the report will use | Back-check percentage |
| Geographic spread, if the population allows | Enumerator training days |
| Report length and number of drafts | Pilot round |
| Dashboard and visualisation extras | Revisit attempts for non-contact |
| Midline round | Translation and back-translation |
| Qualitative components, if genuinely secondary | Supervisor-to-enumerator ratio |
Cutting indicators is the most effective and least damaging saving available. A 70-minute questionnaire cut to 40 minutes raises daily output by roughly half, improves data quality on what remains, and lowers refusal rates. Most instruments carry a third more questions than the report will ever use.
Cutting the pilot is the most damaging. It saves perhaps 3% of the budget and risks discovering, after 400 interviews, that a central question does not translate.
Getting a quote that holds
Send the same specification to every agency: population and geography, target sample with its derivation, sampling method, draft instrument with expected duration, languages, mode, quality requirements stated numerically, deliverables, and timeline. Ask for the six-line budget breakdown above rather than a single figure.
Then ask three questions that reveal how the number was built: how many interviews per enumerator per day is assumed; how many revisit attempts are funded; and are enumerators paid per day or per interview. The answers explain most of the variation between quotes. The full vetting process is in how to choose a household survey agency.
For scoping the sample before you ask for prices, how to determine sample size for a household survey. Our socio-economic and baseline survey service quotes against this breakdown as standard.
Frequently Asked Questions
How much does a socio-economic survey cost in India?
Roughly 3 to 6 lakh for 300 households in a single block, 8 to 18 lakh for a 1,000-household district baseline, and 20 to 45 lakh for a 2,500-household multi-district study. Geographic spread and interview length affect the total more than sample size does.
What is the cost per household for a survey?
Commonly 800 to 1,800 rupees per completed interview for rural household surveys, covering field, supervision, cleaning and analysis. Remote terrain, long questionnaires and multiple languages push it higher; concentrated geography and short instruments bring it down.
Why do survey quotes vary so much?
Because quality control is invisible in the deliverable. Quotes differ mainly on back-check rates, supervisor ratios, revisit budgets, whether enumerators are on day rates or piece rates, and whether cleaning, translation and analysis are included at all.
How can I reduce the cost of a survey?
Cut indicators to those the report will actually use — this shortens interviews and raises daily output. Concentrate geography where the population allows. Reduce report drafts and optional dashboards. Do not cut the pilot, training, back-checks or revisit attempts.
Does an endline cost the same as a baseline?
Usually 70 to 90% of the baseline. The instrument, translation, training materials and sampling frame already exist, but tracking previously surveyed households across migration and address changes adds field effort that partly offsets the saving.
How long does a socio-economic survey take?
A 600-household study typically takes 7 to 10 weeks from approval to final report: about three weeks of design, translation and piloting, two to four weeks of field work, and three to four weeks of cleaning, analysis and reporting.
Is GST charged on survey services?
Yes. Survey, research and consulting services are normally invoiced with 18% GST, which registered businesses can usually claim as input tax credit. Quotes are often given before GST, so check which basis is used.
How much does a focus group discussion cost?
Commonly ₹10,000 to ₹20,000 per FGD, including mobilisation, a trained moderator and note-taker, recording, transcription and translation.
Is a phone survey cheaper than a field survey?
Yes, often by half or more per interview, because there is no travel or lodging. But phone surveys only reach households with phones, work best under 20 minutes, and cannot observe housing, assets or the village directly. For EIA and CSR baselines, a field survey is usually expected; phone follow-ups suit short monitoring rounds.
Can survey costs be shared between an EIA and a CSR baseline?
Often, yes. If the same villages are involved, one well-designed household survey can provide the socio-economic profile for the EIA and the baseline for the company's later CSR programme, saving a second round of mobilisation, design and training.
What should be included in a survey quote?
A breakdown across six lines: field team and travel, design and translation, supervision and quality control, cleaning and processing, analysis and reporting, and tools and licences. A single lump-sum figure cannot be evaluated or compared.
How DSTechnoverse Runs Your Survey
DSTechnoverse is a full-service socio-economic and baseline survey agency based in Indore. We do not just advise — we run the whole study end to end and hand you evidence you can defend:
- Design — objectives, indicators, and sampling (random, stratified, cluster, or multi-stage), with a piloted questionnaire translated into local languages.
- Field data collection — trained enumerators using CAPI (tablet) tools such as KoBoToolbox, ODK, and SurveyCTO-style apps, with GPS stamping, audio audits, and built-in skip-logic validation.
- Quality control — back-checks, spot-checks, and daily high-frequency data monitoring so problems are caught in the field, not after.
- Analysis — SPSS, R, Python, and Excel for indicators, cross-tabulations, and impact estimates, including baseline–endline difference-in-differences.
- A detailed report — cleaned datasets, indicator tables, charts, GIS maps, and clear interpretation, with interactive Power BI / Tableau dashboards on request.
Our survey experience in Indore includes Smart City citizen-feedback surveys, Startup India & MSME surveys, Swachh Survekshan (Swachh Bharat) cleanliness surveys, and skill-development impact evaluations — delivered for government, municipal, corporate, and NGO clients.
Planning a socio-economic, baseline, endline, or willingness-to-pay survey? Talk to our survey team for a scope and quote.
Sources and Further Reading
Official and primary sources for the standards, rules and data discussed on this page.
- World Bank DIME Wiki: field survey, data quality and impact evaluation guidance.
- Ministry of Statistics and Programme Implementation (MoSPI): official Indian surveys, sampling frames and NSS reports.
- ODK (Open Data Kit): open-source tools for CAPI mobile data collection.
- American Statistical Association: statement on p-values (2016): six principles for interpreting p-values correctly.