
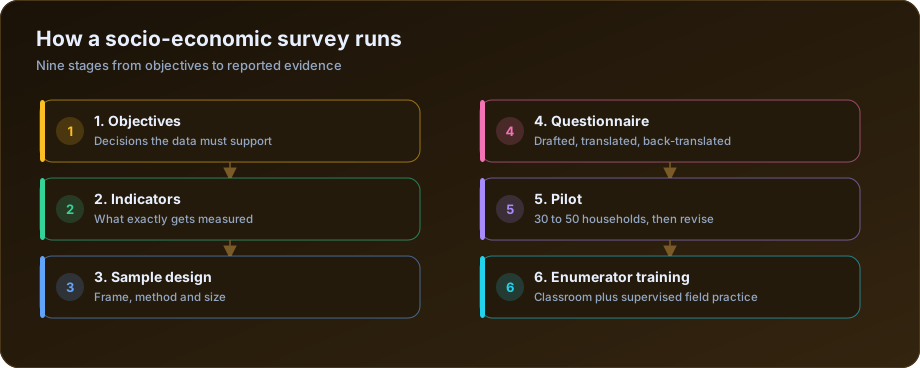
A socio-economic survey is a big undertaking — hundreds or thousands of interviews, real logistics, and data that decisions depend on. Done in the right sequence, it runs smoothly; done haphazardly, it produces unusable results. Here is the step-by-step process.
Step 1: Define objectives and indicators
Start with the decisions the data must support. From there, define the exact indicators you will measure — income, education, health, assets, services, and so on. Everything else flows from this.
Step 2: Design the sample
Decide who you are studying and how you will select them:
- Define the target population and sampling frame
- Choose a sampling method (random, stratified, cluster, multi-stage)
- Calculate the sample size for your precision needs
- Plan for non-response and replacements
Step 3: Develop the questionnaire
Translate your indicators into clear, unambiguous questions. Keep it as short as it can be, use validated question formats where they exist, and structure it logically. Then translate it into local languages.
Step 4: Pilot test
Run a small pilot in conditions like the real field. Piloting catches confusing questions, timing problems, and skip-logic errors before they contaminate the whole study.
Step 5: Recruit and train enumerators
Field data quality depends on the people collecting it. Train enumerators on the questionnaire, interviewing technique, ethics and consent, and the data collection tool (paper or tablet/CAPI).
Step 6: Collect data in the field
Deploy teams with a clear plan and supervision. Throughout fieldwork:
- Run spot-checks and back-checks
- Monitor response rates and data flowing in
- Resolve issues quickly before they compound
Step 7: Clean and validate the data
Check for missing values, outliers, and inconsistencies. Handle them transparently and document every decision.
Step 8: Analyse
Compute your indicators — means, distributions, cross-tabulations — and any deeper analysis your objectives require. Disaggregate by relevant groups (gender, income, location).
Step 9: Report
Present findings clearly with tables, charts, and interpretation tied back to the original objectives. A good report answers the decision questions you started with.
How long each stage actually takes
The nine steps above are not equal in duration, and the ones people underestimate are never the ones they expect.
| Stage | Working days | Where it slips |
|---|---|---|
| Objectives and indicators | 3 to 5 | Stakeholders wanting to add "just one more" question |
| Sample design | 3 to 6 | Waiting for a village list or voter roll |
| Questionnaire drafting | 5 to 8 | Rewriting after each round of internal comment |
| Translation and back-translation | 4 to 7 | Finding a competent independent back-translator |
| Programming into CAPI | 3 to 5 | Skip logic testing across every branch |
| Pilot and revision | 4 to 6 | Discovering a core question does not work |
| Enumerator training | 4 to 6 | Certification failures needing a second round |
| Fieldwork | 15 to 30 | Weather, festivals, migration, refusals |
| Cleaning | 6 to 12 | Undocumented variables, back-check disputes |
| Analysis and reporting | 10 to 15 | Scope creep in the report |
Fieldwork is the visible phase and roughly a third of the timeline. The design and preparation ahead of it take longer than most commissioners expect, and compressing them is the reliable way to produce a survey that has to be partly redone.
Step 1 in practice: from objective to indicator
The single most valuable hour on a survey project is spent converting a vague objective into a countable indicator. The test is whether two different analysts, given the same dataset, would produce the same number.
| Vague objective | Indicator that can actually be measured |
|---|---|
| "Understand the economic condition" | Median monthly household consumption expenditure, in INR |
| "Assess women's empowerment" | Share of women reporting sole or joint say in household purchases above 5,000 INR |
| "Measure water access" | Share of households with an improved source within 500 metres |
| "Check education outcomes" | Net enrolment ratio, ages 6 to 14, by gender |
| "Gauge health burden" | Out-of-pocket health expenditure in the last 30 days, per household |
| "See if livelihoods improved" | Days of paid work in the last 30 days, primary earner |
Write the dummy tables before writing the questionnaire. Sketch the exact tables your final report will contain, with rows, columns and blank cells. Every question in the instrument must fill a cell; anything that fills no cell comes out. This one discipline typically removes a quarter of a draft questionnaire and shortens interviews accordingly.
Fieldwork: what actually happens on the ground
The steps look orderly on paper. In the field, the day runs like this — and the plan needs to accommodate it.
Timing determines who you find. Interviewing between 10am and 4pm on a working day systematically finds the elderly, the unemployed and women at home, and misses wage labourers and salaried workers entirely. Early morning, evening and weekend slots are not a courtesy, they are a sampling requirement.
Seasonality changes the answer. A survey run immediately after harvest and the same survey run in the lean season will produce different income, expenditure and migration figures for the same households. Record the reference period and, for baseline-endline work, run both rounds in the same season. Skipping this makes seasonal variation look like programme impact.
Replacement rules must be written in advance. What happens when a selected household is locked, refuses, or has migrated? Deciding in the field means enumerators picking whoever is convenient, which quietly destroys the sample's probability structure. The rule should specify how many revisits, at what times, and how a replacement is drawn.
Entry protocol matters. Informing the panchayat or local authority before arrival, carrying identification, and having a short plain-language explanation of the study raises cooperation substantially and prevents the day being lost to suspicion.
The checks that run every single day
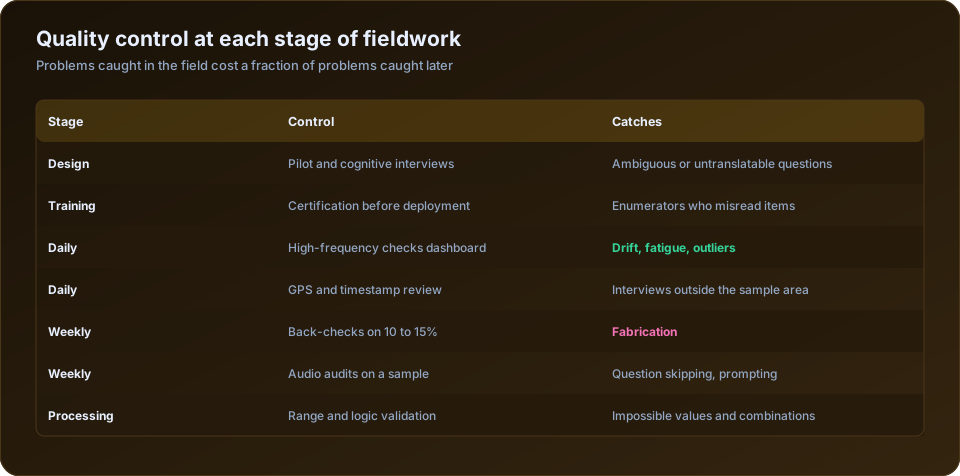
Data arriving from CAPI devices should be reviewed daily, not at the end. A high-frequency check dashboard looking at six things catches nearly everything:
| Daily check | What it reveals |
|---|---|
| Interviews per enumerator per day | A count far above the team suggests shortcuts |
| Median interview duration by enumerator | Consistently short interviews mean skipped sections |
| GPS points against the assigned area | Interviews recorded outside the sample village |
| Don't-know and refusal rates by enumerator | One person driving all the missingness |
| Distribution of key outcomes by enumerator | Systematic differences that cannot be real |
| Consent and completion rates | Rising refusals signalling a community-level problem |
Catching a misunderstanding on day three costs one retraining conversation. Catching it on day thirty costs a re-survey. This is covered in more depth in data quality control in large-scale surveys.
The report the client actually reads
A survey report that starts with methodology loses the reader. Structure it the other way round:
- The answer, in one page — what was found, against the questions that were asked.
- Indicator tables, with confidence intervals and sample sizes per cut.
- Disaggregation by the cuts that matter — gender, social group, location, income quintile.
- Maps, where geography carries meaning.
- Limitations, stated plainly: who was missed, what the response rate was, what the data cannot support.
- Methodology annexe, with sampling, weights, instruments and the cleaning log.
The limitations section builds credibility rather than undermining it. A report claiming a survey went perfectly invites more scepticism than one that says 8% of selected households could not be reached and describes how they differed.
For the components see key socio-economic indicators every baseline should measure, how to design a baseline survey questionnaire and training enumerators for a quality field survey. Our socio-economic and baseline survey service runs all nine stages. The World Bank's LSMS guidelines remain the best free reference on household survey design and are worth consulting before finalising an instrument.
The takeaway
A socio-economic survey is a chain, and its weakest link sets its quality. Move deliberately through objectives, sampling, design, piloting, training, fieldwork, cleaning, analysis, and reporting — and you end up with data that genuinely informs decisions.
Frequently Asked Questions
What are the steps in conducting a socio-economic survey?
Define objectives and indicators, design the sample, develop and translate the questionnaire, pilot and revise, train and certify enumerators, collect data with daily quality checks, clean and validate, analyse, and report. Preparation takes longer than fieldwork.
How long does a socio-economic survey take from start to finish?
Eight to twelve weeks for a 1,000-household district survey. Fieldwork is typically three to six weeks of that; design, translation, piloting and training take four to six weeks before anyone enters the field.
How many enumerators do I need?
Divide the sample by the working days available and by a realistic daily rate — six to eight interviews per enumerator per day for a 45-minute questionnaire, fewer in scattered terrain. Keep the supervisor ratio at no worse than one to six.
What should be piloted before a full survey?
The complete instrument in the local language, with 30 to 50 real respondents from the target population. The pilot tests question comprehension, translation, skip logic, interview duration and refusal patterns. Revise before printing or finalising the CAPI programme.
How do you handle households that refuse or are not at home?
Write the rule before fieldwork begins: how many revisit attempts, at what times of day, and how a replacement household is selected if all attempts fail. Record every non-contact and refusal so response rates can be reported and non-response bias assessed.
What is the difference between a pilot and a pre-test?
A pre-test checks individual questions for comprehension, often through cognitive interviews with a handful of respondents. A pilot runs the entire instrument and field protocol end to end under realistic conditions. Both are worth doing; the pilot is not optional.
How DSTechnoverse Runs Your Survey
DSTechnoverse is a full-service socio-economic and baseline survey agency based in Indore. We do not just advise — we run the whole study end to end and hand you evidence you can defend:
- Design — objectives, indicators, and sampling (random, stratified, cluster, or multi-stage), with a piloted questionnaire translated into local languages.
- Field data collection — trained enumerators using CAPI (tablet) tools such as KoBoToolbox, ODK, and SurveyCTO-style apps, with GPS stamping, audio audits, and built-in skip-logic validation.
- Quality control — back-checks, spot-checks, and daily high-frequency data monitoring so problems are caught in the field, not after.
- Analysis — SPSS, R, Python, and Excel for indicators, cross-tabulations, and impact estimates, including baseline–endline difference-in-differences.
- A detailed report — cleaned datasets, indicator tables, charts, GIS maps, and clear interpretation, with interactive Power BI / Tableau dashboards on request.
Our survey experience in Indore includes Smart City citizen-feedback surveys, Startup India & MSME surveys, Swachh Survekshan (Swachh Bharat) cleanliness surveys, and skill-development impact evaluations — delivered for government, municipal, corporate, and NGO clients.
Planning a socio-economic, baseline, endline, or willingness-to-pay survey? Talk to our survey team for a scope and quote.
Sources and Further Reading
Official and primary sources for the standards, rules and data discussed on this page.
- World Bank DIME Wiki: field survey, data quality and impact evaluation guidance.
- Ministry of Statistics and Programme Implementation (MoSPI): official Indian surveys, sampling frames and NSS reports.
- ODK (Open Data Kit): open-source tools for CAPI mobile data collection.
- American Statistical Association: statement on p-values (2016): six principles for interpreting p-values correctly.