
Ask any experienced modeller where AERMOD studies most often go wrong, and the answer is rarely the model itself — it is the meteorology. AERMOD does not read raw weather data. It needs a processed, quality-controlled meteorological file produced by its preprocessor, AERMET.
What AERMET does
AERMET takes raw observations and converts them into the boundary-layer parameters AERMOD uses to disperse the plume hour by hour. In simple terms, it answers: how turbulent, how stable, and how mixed is the atmosphere at each hour?
It works in three stages:
- Stage 1 — Extract and QA raw surface and upper-air data, flagging bad or missing values.
- Stage 2 — Merge the surface and upper-air datasets into a single record.
- Stage 3 — Compute boundary-layer parameters such as friction velocity, Monin-Obukhov length, mixing height, and surface heat flux.
The data AERMET needs
- Surface observations — wind speed and direction, temperature, cloud cover
- Upper-air soundings — vertical temperature profiles (usually the daily radiosonde)
- Surface characteristics — albedo, Bowen ratio, and surface roughness for the area around the site
Why surface characteristics matter more than people expect
Albedo, Bowen ratio, and roughness describe how the ground exchanges heat and momentum with the air. Get them wrong — for example, using "urban" values for a rural site — and the computed turbulence is wrong, which shifts your predicted concentrations. These parameters vary by season and by wind-direction sector, and defining them correctly is a big part of a defensible study.
Common AERMET pitfalls
- Missing or poor-quality upper-air data leaving gaps in the record
- Using a met station too far from, or too unrepresentative of, the site
- Careless land-use classification driving wrong surface parameters
- Insufficient data recovery (regulators often expect ~90% valid hours per year)
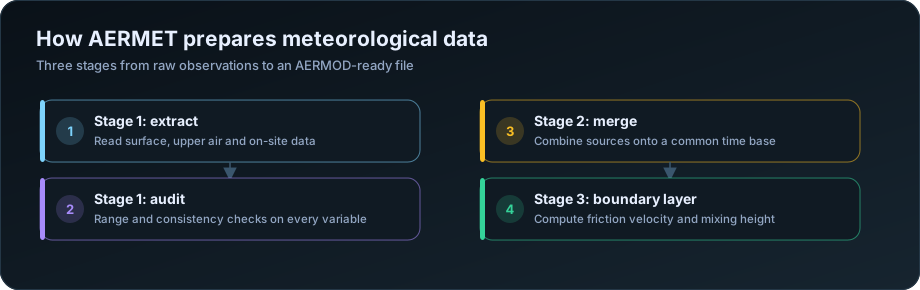
The three stages, and what each produces
AERMET runs in three sequential stages, and understanding which stage a problem belongs to makes troubleshooting far faster.
| Stage | Input | What it does | Output |
|---|---|---|---|
| 1 | Raw surface, upper air, on-site data | Extracts records and audits every variable against valid ranges | Extracted, quality-flagged files |
| 2 | Stage 1 output | Merges all sources onto one common 24-hour time base | A merged hourly dataset |
| 3 | Merged data plus surface characteristics | Computes boundary layer parameters | SFC and PFL files for AERMOD |
The critical point is that stage 3 is where the physics happens. Stages 1 and 2 are bookkeeping. Stage 3 estimates friction velocity, Monin-Obukhov length, convective velocity scale, sensible heat flux and mixing height — the parameters that actually determine how the plume disperses. Those estimates depend heavily on the surface characteristics you supply, which is why those three numbers matter more than most practitioners expect.
The data AERMET requires
| Data type | Source in India | Variables |
|---|---|---|
| Surface observations | IMD station, airport (MET/AWS), on-site tower | Wind speed and direction, temperature, cloud cover, pressure |
| Upper air soundings | IMD radiosonde stations | Vertical temperature profile, twice daily |
| On-site tower, if available | Project site | Multi-level wind and temperature, solar radiation |
| Surface characteristics | Land use analysis around the station | Albedo, Bowen ratio, surface roughness |
Upper air data is what most Indian studies struggle with, because radiosonde stations are sparse. The nearest sounding may be several hundred kilometres away. Using it is standard practice and generally accepted, but the choice should be stated, and if the sounding station sits in a materially different setting — coastal versus inland, plain versus plateau — the report should acknowledge it.
Where no adequate observed data exists, prognostic meteorological data from a model such as WRF is increasingly used, processed through MMIF into AERMET-compatible form. This is accepted in many jurisdictions but needs justification rather than silent substitution.
Update, November 2026 — public airport data. Many studies used the hourly airport records in NOAA's Integrated Surface Database (ISD) as their surface data, because they are free and AERMET reads them directly. NOAA's legacy ISD files stopped updating in late August 2025, so they cannot be used for study periods after that date. The alternatives — site measurements from the baseline season, NOAA's newer hourly product, NASA POWER and ERA5 reanalysis, IMD records and prognostic meteorology — are compared in our guide NOAA ISD stopped in 2025: meteorological data for AERMOD now. Upper-air soundings from the Integrated Global Radiosonde Archive are still being updated.
Data recovery, and what to do about gaps
The convention is that a modelling year needs at least 90% valid hours. Below that, the year is generally not acceptable on its own.
| Recovery | Position |
|---|---|
| Above 90% | Acceptable |
| 80 to 90% | Sometimes accepted with justification and gap analysis |
| Below 80% | Use a different year |
Two things matter beyond the headline percentage. Where the gaps fall — 10% missing spread evenly is very different from 10% concentrated in the monsoon, which would remove an entire seasonal regime from the assessment. Which variable is missing — missing cloud cover degrades stability classification for every hour, while missing pressure matters little.
Substitution of short gaps is standard practice: interpolation across one or two missing hours, or substitution from a nearby station for longer gaps. What matters is documenting it. A report that states "97.3% recovery; 214 hours interpolated, 61 hours substituted from the secondary station" is defensible. One that reports 97.3% with no explanation invites questions.
Five years of data is the usual expectation where available; a single well-justified representative year is sometimes accepted for smaller assessments. The point of multiple years is to avoid an atypical year driving the result.
Surface characteristics: the three numbers that move results
| Parameter | What it represents | Typical range |
|---|---|---|
| Surface roughness (z0) | Height of obstacles impeding flow | 0.001 m water, 0.03 m grassland, 0.4 m forest, 1.0 m urban |
| Albedo | Fraction of solar radiation reflected | 0.14 forest, 0.18 cropland, 0.20 urban, 0.60 fresh snow |
| Bowen ratio | Sensible to latent heat flux ratio | 0.1 water, 0.5 irrigated crops, 2.0 dry grassland, 6.0 desert |
Two rules govern their assignment and both are frequently broken.
Assign them by sector, not as a single value. Land use around a met station is rarely uniform. AERSURFACE divides the surroundings into up to twelve wind-direction sectors, so that hours with wind from the forested sector use forest values and hours from the town use urban values. Applying one averaged number across all directions loses exactly the variation that matters.
Assign them by season. The same field is bare soil in May, flooded paddy in August and stubble in December. Bowen ratio in particular swings enormously between irrigated and dry seasons.
The consequence of getting roughness wrong is direct: too low a value means the model generates less mechanical turbulence, disperses the plume less, and predicts higher ground-level concentrations. Reviewers check this, and urban roughness applied over farmland is one of the more common findings. See terrain and land use in AERMOD.
Representativeness: the question behind all of it
The real question is not whether AERMET ran successfully. It is whether the meteorology it processed describes the air at your site.
| Check | Why |
|---|---|
| Distance from site to station | Under 50 km is comfortable; beyond needs justification |
| Elevation difference | Large differences change wind regime and stability |
| Terrain setting | Coastal station for an inland site, or vice versa, is a problem |
| Land use similarity | Airport surroundings differ from an industrial estate |
| Wind rose comparison | Compare against any on-site data, however short |
| Same climatic zone | Crossing a mountain range is not a small matter |
Even three months of on-site wind data is worth collecting where possible. It cannot replace a full modelling year, but comparing its wind rose against the station's answers the representativeness question with evidence rather than assertion.
For the wider input set see the AERMOD input data checklist; for reviewing the output, how to read AERMOD output; and for the errors that fail review, 10 common AERMOD modelling mistakes. Our AERMOD air dispersion modelling service handles met data procurement and AERMET processing. The US EPA AERMET user guide documents every option in detail.
The bottom line
A clean, representative, well-processed AERMET file is the foundation of a credible AERMOD study. If the meteorology is questionable, no amount of careful source modelling will save the result. This is exactly the kind of detailed, easy-to-get-wrong work that a dedicated modelling desk handles every day.
Frequently Asked Questions
What does AERMET do?
It converts raw meteorological observations into the boundary layer parameters AERMOD needs. It runs in three stages — extraction and quality audit, merging onto a common time base, and computation of friction velocity, mixing height and stability parameters — producing the SFC and PFL files AERMOD reads.
What meteorological data does AERMOD need?
Hourly surface observations of wind speed and direction, temperature and cloud cover; twice-daily upper air soundings for the vertical temperature profile; and surface characteristics — albedo, Bowen ratio and surface roughness — for the area around the station.
What data recovery rate does AERMOD require?
At least 90% valid hours in the modelling year. Between 80 and 90% is sometimes accepted with justification. Where gaps fall matters as much as the percentage — 10% missing concentrated in the monsoon removes a whole seasonal regime.
How far away can the meteorological station be?
Within about 50 km is generally comfortable, provided terrain, elevation and land use are similar. Greater distances need explicit justification, and a station in a materially different setting — coastal for an inland site — is difficult to defend regardless of distance.
What are surface characteristics in AERMET?
Albedo, Bowen ratio and surface roughness, describing how the ground around the meteorological station reflects radiation, partitions heat and impedes airflow. They should be assigned by wind-direction sector and by season, not as single averaged values.
Can I use WRF data instead of observations?
Prognostic meteorological data processed through MMIF is increasingly accepted where adequate observations do not exist, but it requires explicit justification rather than silent substitution. State why observed data was insufficient and how the modelled data was prepared.
Need a modelling or EIA data desk without the overhead? DSTechnoverse works as a confidential, white-label subcontractor for air and water dispersion modelling and EIA data analysis. Get in touch to scope your next project.