
India produces a huge volume of research every year — doctoral theses, university projects, market studies, and development-sector evaluations. Behind almost all of it sits one common need: research data analysis. This guide covers what it involves and how scholars and businesses in India can get reliable support.
Why demand is growing
- Rising numbers of PhD and postgraduate scholars who must analyse primary data
- More survey and market research driven by a fast-growing economy
- NGOs and development programmes required to measure and report impact
- Businesses adopting data-driven decision making
Not everyone who needs analysis is a trained statistician — hence the demand for specialist support.
What research data analysis covers in practice
- Study and survey design — variables, sampling, sample size
- Data cleaning and coding — preparing raw responses for analysis
- Descriptive and inferential statistics — from summaries to hypothesis tests
- Advanced techniques — regression, factor analysis, SEM, where the research needs them
- Interpretation and write-up — turning output into a results chapter or report
What to expect from a good analysis partner in India
- Tool flexibility — SPSS, R, Python, or Stata, as your guide or journal requires.
- Method justification — a clear reason for every test used.
- Plain-language interpretation — so you can defend your own work in a viva or boardroom.
- Reasonable cost — India offers strong analytical talent at competitive rates.
- Confidentiality — your research stays yours.
For PhD scholars specifically
Analysis support should help you understand and defend your results, not just hand you tables. Expect help selecting tests, checking assumptions, running the analysis, and preparing the results chapter — with you staying firmly in control of the intellectual work.
For businesses and agencies
Whether it is customer surveys, product research, or operational data, the value is the same: rigorous methods that make your conclusions trustworthy enough to act on.
Wherever you sit, the goal is identical — the right analysis, clearly explained, that stands up when someone questions it.
What the Indian market looks like from the inside
Research data analysis in India is served by four quite different kinds of provider, and knowing which you are talking to explains most of the variation in price and quality.
| Provider type | Typical strength | Typical weakness |
|---|---|---|
| University statistics departments | Methodological depth, credibility | Slow, capacity limited by teaching loads |
| Specialist analytics firms | Process, documentation, turnaround | Higher price point |
| Individual freelance analysts | Cost, flexibility | Variable quality, no continuity |
| Thesis-support shops | Speed, familiarity with formats | Wide range from legitimate to ghostwriting |
The fourth category is where scholars run into trouble. Legitimate thesis analysis support is a real and valuable service; operations that will also write your discussion chapter are selling something that puts your degree at risk. The distinction is covered in data analysis help for PhD scholars, and it is worth reading before you engage anyone in that segment.
Why demand has grown so sharply
Four forces, and they are worth naming because they explain what the market is likely to do next.
Research output has scaled faster than methods training. India produces a very large volume of doctoral and Masters research, but quantitative methods teaching has not scaled at the same rate in every department. A scholar can be an excellent domain researcher and have had two weeks of statistics in total.
CSR compliance created a measurement industry. Section 135 of the Companies Act obliges qualifying companies to spend on CSR and, increasingly, to demonstrate outcomes. That has turned baseline and endline measurement from an NGO practice into a corporate requirement, described further in baseline surveys for CSR and development projects.
Government programmes now come with evaluation clauses. Scheme evaluations, third-party assessments and outcome-linked funding all require someone to analyse survey data defensibly.
Journals tightened their reporting standards. Effect sizes, confidence intervals and assumption reporting are now expected where a bare p-value once passed. Work that was acceptable a decade ago comes back with revisions today.
What things cost, and why quotes vary so much
| Work | Typical range (INR) |
|---|---|
| Descriptive tables and cross-tabs | 8,000 to 20,000 |
| Masters dissertation analysis | 12,000 to 30,000 |
| PhD chapter with modelling | 25,000 to 60,000 |
| Scale validation with factor analysis | 30,000 to 70,000 |
| NGO survey report, 1,000 respondents | 80,000 to 2,00,000 |
| Impact evaluation with baseline and endline | 1,50,000 to 5,00,000 |
Two quotes for the same brief can differ by a factor of three, and the reason is almost always the same: one provider has seen the actual data and one has not. Cleaning consumes roughly 40% of project hours, so a dataset arriving as six inconsistent Excel files costs far more to analyse than the same study delivered from a CAPI platform with a codebook.
The practical consequence: send a redacted sample of the real data with your enquiry. A quote given on a described dataset is an estimate of an imagined one.
The problems specific to Indian research data
Some of these will be familiar to anyone working with field data here, and none of them appear in international textbooks.
| Issue | Why it arises | What it demands |
|---|---|---|
| Multilingual questionnaires | Instruments translated into Hindi, Marathi, regional languages | Back-translation, and reliability checked per language |
| Income measurement | Irregular, seasonal, multi-source, often understated | Asset indices or consumption proxies alongside income |
| Household definition | Joint families, seasonal migrants, split residence | An explicit definition applied consistently |
| Caste and community variables | Categories differ across states and schemes | Consistent coding, careful reporting |
| Skewed distributions | Income, land holding, health expenditure | Medians, log transforms, robust methods |
| Cluster sampling by village | Standard field practice | Design effects and clustered standard errors |
| Recall periods | Seasonal agricultural income, festival spending | Reference periods matched to the local calendar |
The clustering issue is the most frequently mishandled. A survey of 25 households in each of 40 villages is not 1,000 independent observations, and analysing it as though it were will overstate every significance test in the report. This is a design fact that no diagnostic on the dataset will flag — the analyst simply has to know how the sample was drawn. See sampling methods for household surveys.
What good looks like locally
An analysis partner working well in this market should be able to do all of the following:
- Work in SPSS and at least one of R, Stata or Python, because clients and universities differ in what they will accept.
- Handle survey weights and clustered designs, not just simple random sample assumptions.
- Produce output in the format the destination requires — APA for a thesis, a funder's template for a programme report, a Power BI or Tableau dashboard for a corporate client.
- Hand over the syntax or script as a matter of course.
- Explain a null result rather than treating it as a failure.
- Sign an NDA and be explicit about data storage and deletion.
Location matters less than it used to. Analysis work moves over email and video calls, and a firm in Indore serves clients in Mumbai, Delhi and abroad without friction. What matters is domain familiarity with the kind of data you have.
Getting a useful engagement started
Send numbered research questions, the study design, a redacted data sample, a codebook and your real deadline. Ask for a checkpoint after cleaning but before analysis, so problems surface while they are still cheap to fix. The full vetting process is in how to hire a survey data analysis consultant, and the deliverables to expect are in what are statistical data analysis services.
Our statistical and research data analysis service operates from Indore across SPSS, R and Python. For national context on survey methods and data standards, the Ministry of Statistics and Programme Implementation publishes the sampling and estimation documentation behind India's official surveys, which is a useful benchmark for anyone designing field research here.
Frequently Asked Questions
How much does research data analysis cost in India?
Roughly 8,000 to 20,000 rupees for descriptive tables, 12,000 to 30,000 for a Masters dissertation, 25,000 to 60,000 for a PhD chapter with modelling, and 80,000 upwards for an NGO survey report. The condition of your data affects the price more than the complexity of the statistics.
How do I find a reliable data analyst in India?
Ask which test they would use for your specific design and why, request a redacted sample report, and confirm they hand over syntax as standard. Domain familiarity with your kind of data matters more than physical proximity, since the work is delivered remotely.
What software do Indian universities accept?
SPSS remains the most widely recognised in social science departments, but R, Stata and Python are accepted across the board. Examiners care about whether the method is appropriate and correctly reported, not which software produced the output. State the software and version in your methods section.
How long does analysis take for an Indian survey project?
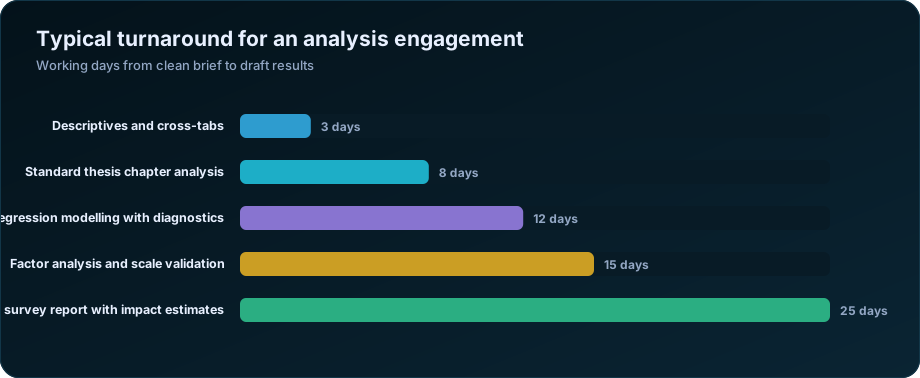
From a clean brief: about a week for a dissertation chapter, two to three weeks for a PhD chapter with modelling, and four to six weeks for a full survey report with subgroup analysis. Multilingual instruments and undocumented datasets add time before analysis can start.
Do I need to worry about clustered sampling in my analysis?
Yes, if your survey selected villages, blocks or schools and then households within them. Treating clustered data as a simple random sample overstates significance. The analysis needs design effects, clustered standard errors or a mixed-effects model.
Can analysis be done remotely?
Yes, and almost all of it is. Datasets, codebooks and drafts move by secure transfer, with review over video calls. Insist on a written NDA and clarity about where data is stored and when it will be deleted.
Need help turning your data into defensible results? DSTechnoverse offers statistical and research data analysis services in SPSS, R, and Python — survey analysis, thesis and dissertation support, and business statistics. Get in touch to discuss your dataset.