
One of the most important decisions in any study happens before you collect a single response: how big should your sample be? Get it wrong and you either miss real effects or waste time and money. Here is how to think about it.
Why sample size matters
- Too small: your study is underpowered — it may fail to detect a real effect that exists.
- Too large: you spend far more effort than needed and may flag trivial differences as "significant."
The goal is the right size — big enough to answer your question, no bigger.
The four drivers of sample size
Sample size is determined by four interconnected factors:
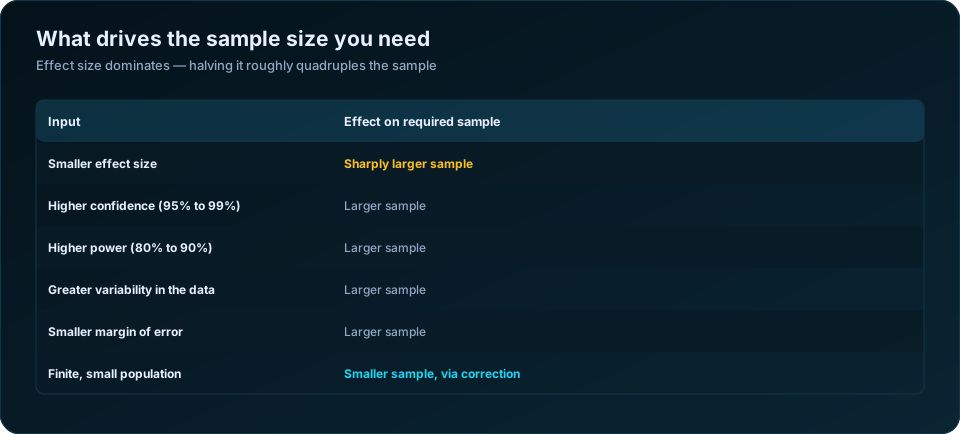
- Effect size — how big a difference or relationship you expect. Smaller effects need bigger samples to detect.
- Significance level (alpha) — usually 0.05. The risk of a false positive.
- Power — usually 0.80. The chance of detecting an effect that truly exists.
- Variability — how spread out the data is. More variability needs a larger sample.
Fix three of these and the fourth (sample size) follows.
For surveys estimating a proportion
If you are estimating a percentage in a population, you also consider:
- Confidence level — commonly 95%
- Margin of error — how precise you need to be (e.g. ±5%)
- Population size — matters mainly for small populations
A classic result: estimating a proportion to ±5% at 95% confidence needs roughly 385 respondents for a large population.
How to actually calculate it
- Power analysis software — G*Power (free) is the standard for experiments and group comparisons
- Online sample size calculators — quick for survey proportions
- R packages —
pwrand others for reproducible calculations
You feed in your expected effect size, alpha, and power, and get the required sample.
The hardest input: effect size
Estimating the effect size before you have data is the tricky part. Use:
- Results from similar past studies
- A pilot study
- Established conventions for "small," "medium," and "large" effects
Do it before you collect data
Calculating sample size afterwards is too late. Plan it during study design, document your assumptions, and you protect both your budget and your ability to find the answer you are looking for.
A reference table you can actually use
Most people asking "how many respondents do I need?" want a number, not a formula. For a survey estimating a percentage in a large population, at 95% confidence, the answer depends only on your margin of error and how close the true value sits to 50%:
| Margin of error | If the answer is near 50% | If near 20% or 80% | If near 10% or 90% |
|---|---|---|---|
| ±10% | 96 | 62 | 35 |
| ±7% | 196 | 126 | 71 |
| ±5% | 384 | 246 | 139 |
| ±3% | 1,067 | 683 | 385 |
| ±2% | 2,401 | 1,537 | 865 |
| ±1% | 9,604 | 6,147 | 3,458 |
Two things to read off this table. First, precision is expensive in a punishing way — going from ±5% to ±1% costs twenty-five times the sample, not five times. Second, the familiar figure of about 384 is simply the ±5% column at the most conservative assumption. It is not a magic number, and it is not right for every study.
Sample size for comparing means
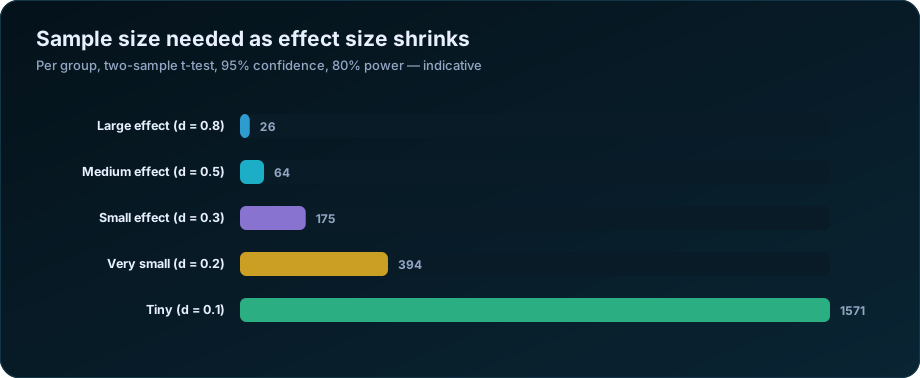
When your outcome is a number rather than a percentage — monthly income, yield per hectare, test score — the driver becomes the effect size: the difference you want to detect, expressed in standard deviations.
| Effect size (Cohen's d) | Plain description | Needed per group (80% power) | Needed per group (90% power) |
|---|---|---|---|
| 0.8 | Large — obvious to the naked eye | 26 | 34 |
| 0.5 | Medium — visible in a chart | 64 | 86 |
| 0.3 | Small but often meaningful | 175 | 234 |
| 0.2 | Small | 394 | 527 |
| 0.1 | Very small | 1,571 | 2,103 |
This is why effect size dominates every other input. Halving the effect you want to detect roughly quadruples the sample you need. If your budget stops at 200 households per arm, you should know at the design stage that effects smaller than about d = 0.28 will likely go undetected — and say so in the protocol, rather than discovering it in the discussion section.
The four adjustments that field surveys always need
Textbook formulas assume a simple random sample of independent individuals with perfect response. Real household surveys violate all three assumptions, and each violation inflates the number.
1. Design effect (clustering). Interviewing 20 households in each of 30 villages is cheaper than 600 scattered households, but households within a village resemble each other, so each one carries less independent information. Multiply your sample by the design effect:
| Situation | Typical design effect |
|---|---|
| Simple random sample | 1.0 |
| Stratified sample, well-chosen strata | 0.9 to 1.0 |
| Cluster sample, homogeneous outcome (e.g. water source) | 2.0 to 4.0 |
| Cluster sample, heterogeneous outcome (e.g. income) | 1.5 to 2.0 |
| Typical multi-stage household survey | 1.5 to 2.0 |
2. Non-response. If you expect 85% cooperation, divide by 0.85 — an 18% increase. Migration, locked houses and refusals are normal, not exceptional.
3. Attrition between rounds. For a baseline and endline design, you must survive losing households between the two rounds. Panel attrition of 10 to 20% per year is common in mobile populations.
4. Subgroup analysis. This is the one that catches people out. If you plan to report results separately for women-headed households, or for three income terciles, each subgroup needs its own adequate sample — not a share of the total. Wanting four subgroup estimates at ±7% each is close to four separate surveys.
Putting them together for a village-level study wanting ±5% at 95% confidence:
| Step | Calculation | Running total |
|---|---|---|
| Base (proportion near 50%) | Standard formula | 384 |
| Design effect 1.6 | 384 × 1.6 | 615 |
| Non-response 85% | 615 ÷ 0.85 | 724 |
| Endline attrition 12% | 724 ÷ 0.88 | 823 |
| Final target | Round up | 825 households |
The base formula said 384. The realistic answer is more than double that — which is exactly the conversation to have with a funder before fieldwork starts, not after.
Finite populations, and when small is fine
If you are surveying a genuinely small, closed population — 300 employees, 140 villages in a district, 45 treatment plants — the finite population correction reduces the requirement substantially:
| Total population | Sample for ±5%, 95% confidence |
|---|---|
| 100 | 80 |
| 250 | 152 |
| 500 | 218 |
| 1,000 | 278 |
| 5,000 | 357 |
| 50,000 | 381 |
| 1,000,000 | 384 |
Notice that beyond about 20,000 the population size stops mattering almost entirely. A national survey and a state survey need broadly the same sample for the same precision — a fact that surprises most clients and saves a great deal of money.
Tools, and what to put in your protocol
| Tool | Best for | Cost |
|---|---|---|
| G*Power | t-tests, ANOVA, regression, chi-square | Free |
| R, the pwr package | Reproducible power analysis in a script | Free |
| Stata power command | Complex survey and cluster designs | Licensed |
| OpenEpi | Quick proportion and two-group calculations in a browser | Free |
| SPSS SamplePower | Existing SPSS environments | Licensed |
Whichever you use, document six things in the protocol: the primary outcome, the effect size you want to detect and why it is the smallest one worth acting on, alpha, power, the assumed design effect, and the assumed non-response rate. Reviewers reject sample size sections not because the number is wrong but because the assumptions are missing, so nobody can judge whether the number is wrong.
For the design decisions that sit around this calculation, see sampling methods for household surveys and our guide to determining sample size for a household survey. If the study will be analysed with a comparison group, difference-in-differences has its own power implications worth reading first.
Frequently Asked Questions
Is 384 always the right sample size?
No. 384 is what you need to estimate a percentage to within ±5% at 95% confidence in a large population, assuming a simple random sample and perfect response. Cluster sampling, non-response, attrition and subgroup reporting all push it higher; a small closed population pulls it lower.
Does a bigger population need a bigger sample?
Only up to a point. Above roughly 20,000 people, population size stops affecting the required sample almost entirely. Surveying a city of 2 lakh and a state of 7 crore takes a similar sample for the same precision.
What sample size do I need for a PhD thesis?
It depends on the analysis, not the degree. A regression with eight predictors wants at least 10 to 20 observations per predictor, so 100 to 160 minimum. Structural equation modelling typically wants 200 or more. A simple two-group comparison for a medium effect needs about 64 per group. Calculate from your planned analysis, then justify it.
What happens if my sample is too small?
Your study loses the ability to detect the effect you are looking for. You are likely to report a non-significant result that is uninformative rather than reassuring, and any significant result you do find will tend to overstate the true effect size — a well-documented bias in small studies.
Can I calculate sample size after collecting data?
You can calculate the effect size you were powered to detect, which is a useful and honest thing to report. What you should not do is compute "observed power" from your own p-value — it adds no information and is discouraged in the methods literature. Plan power in advance.
How do I choose the effect size before I have data?
Three legitimate sources: previous studies on the same outcome, a pilot study, or a decision-based threshold — the smallest change that would actually alter what your organisation does. The third is usually the most defensible for applied and evaluation work.
Need help turning your data into defensible results? DSTechnoverse offers statistical and research data analysis services in SPSS, R, and Python — survey analysis, thesis and dissertation support, and business statistics. Get in touch to discuss your dataset.