
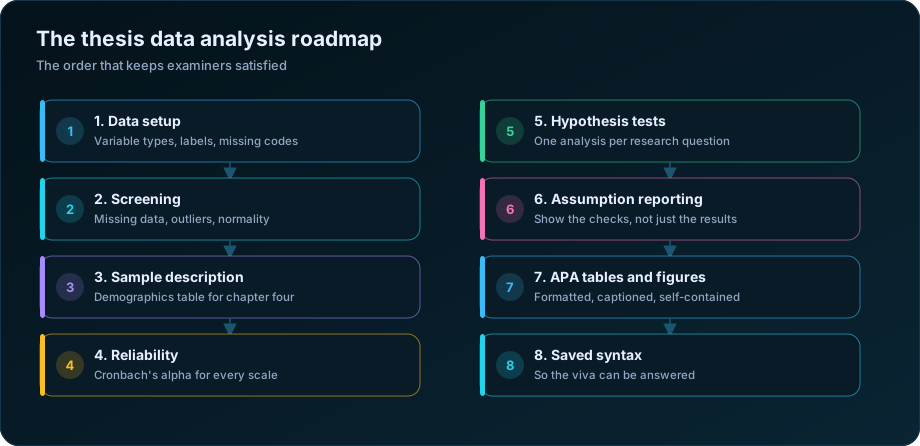
SPSS is the workhorse of thesis analysis in the social sciences, management, and health research. If you are staring at your dataset wondering where to begin, this overview walks through the journey from raw data to a finished results chapter.
Step 1: Set up your data correctly
In SPSS, get the Variable View right first:
- Name each variable clearly
- Set the measure correctly (nominal, ordinal, or scale) — this affects which tests SPSS offers
- Add value labels (e.g. 1 = Male, 2 = Female)
- Define missing-value codes
A clean setup here prevents errors everywhere downstream.
Step 2: Clean and screen the data
- Run frequencies on every variable to spot impossible values
- Check for and handle missing data
- Reverse-code any negatively worded scale items
- Compute scale scores where needed (Transform → Compute Variable)
Step 3: Describe your sample
Every results chapter opens with descriptive statistics:
- Demographics via Frequencies and Descriptives
- Means and standard deviations for your key variables
- Tables and charts summarising who took part
Step 4: Test reliability
If you use multi-item scales, check internal consistency with Cronbach's alpha (Analyze → Scale → Reliability Analysis). Report alpha for each scale — reviewers expect it.
Step 5: Run your main analyses
Match the test to your hypotheses:
- Compare two groups: Independent-Samples T Test
- Compare 3+ groups: One-Way ANOVA
- Relationships: Correlate → Bivariate
- Prediction: Regression → Linear or Binary Logistic
- Categorical associations: Crosstabs with Chi-Square
Always check assumptions before trusting the output.
Step 6: Interpret and report
For each test, report the statistic, degrees of freedom, p-value, and effect size, then explain what it means for your hypothesis in plain language. Paste clean tables into your chapter — do not dump raw SPSS output.
Step 7: Keep your syntax
Use the Paste button to save the syntax for every analysis. It makes your work reproducible and lets you re-run everything instantly if the data changes.
A word of realism
SPSS is approachable, but thesis analysis still demands the right method choices and honest interpretation. If a test or a reviewer's comment leaves you stuck, targeted support can save weeks — while you stay in command of the intellectual work.
Where each procedure lives in the menus
The hardest part of SPSS for a first-time user is not the statistics — it is finding the procedure. This table maps the analyses a thesis typically needs to the menu path that runs them.
| What you need | Menu path |
|---|---|
| Frequencies and percentages | Analyze > Descriptive Statistics > Frequencies |
| Means, SD, skewness | Analyze > Descriptive Statistics > Descriptives |
| Normality tests and Q-Q plots | Analyze > Descriptive Statistics > Explore |
| Cross-tabulation and chi-square | Analyze > Descriptive Statistics > Crosstabs |
| Cronbach's alpha | Analyze > Scale > Reliability Analysis |
| Independent t-test | Analyze > Compare Means > Independent-Samples T Test |
| Paired t-test | Analyze > Compare Means > Paired-Samples T Test |
| One-way ANOVA with post-hoc | Analyze > Compare Means > One-Way ANOVA |
| Two-way or repeated-measures ANOVA | Analyze > General Linear Model > Univariate / Repeated Measures |
| Correlation | Analyze > Correlate > Bivariate |
| Linear regression | Analyze > Regression > Linear |
| Logistic regression | Analyze > Regression > Binary Logistic |
| Exploratory factor analysis | Analyze > Dimension Reduction > Factor |
| Non-parametric tests | Analyze > Nonparametric Tests > Independent Samples |
| Multiple imputation | Analyze > Multiple Imputation > Impute Missing Data Values |
Two settings inside these dialogs are worth knowing because their defaults are wrong for thesis work. In One-Way ANOVA, Options > Homogeneity of variance test is off by default, so Levene's test does not appear unless you tick it. In Linear Regression, Statistics > Collinearity diagnostics and Plots > residual plots are both off, which means the diagnostics an examiner will ask for are absent from your default output.
The Paste button, and why it changes everything
Every SPSS dialog has a Paste button next to OK. Clicking Paste writes the equivalent command into a syntax window instead of running it immediately; you then run it from there.
Build this habit from day one. The reasons compound:
- When your supervisor asks you to re-run everything excluding respondents under 21, you edit one line rather than repeating forty dialog sequences.
- When you discover a coding error three weeks in, you fix the recode and re-run the whole chain in seconds.
- When your viva asks how you handled a particular transformation, the answer is in a file you can open.
- When a reviewer asks for a sensitivity analysis, it is an afternoon rather than a fortnight.
Save the .sps syntax file alongside your data and submit it as an appendix if your department allows. It is the single strongest signal that your analysis is reproducible, and it costs nothing beyond a changed habit.
Setting up the data so nothing breaks later
Most SPSS problems in thesis work originate in Variable View, not in the analysis.
| Setting | Get this right |
|---|---|
| Measure column | Scale, Ordinal or Nominal — SPSS uses it to decide what it will let you do |
| Missing values | Declare 99, 999 and similar codes explicitly, or they enter your means |
| Value labels | 1 = Male, 2 = Female — makes output readable and prevents errors |
| Variable names | No spaces, under 32 characters, meaningful |
| Variable labels | The full question text, so tables explain themselves |
| Decimals | Set to 0 for categorical codes, so output is not cluttered |
The missing-values row causes the most damage and is the easiest to miss. A "don't know" coded 99 and left undeclared will silently inflate every mean containing it. After importing any dataset, run Descriptives on everything and check the minimum and maximum of each variable — a maximum of 99 on a five-point scale is the tell.
The three output tables examiners look for first
The demographics table. Chapter four almost always opens with a sample profile: n, percentage, by gender, age band, education, location. Build it from Frequencies, then reformat. It answers "who did you actually reach" before any finding is presented.
The reliability table. For every multi-item scale: number of items, Cronbach's alpha, and ideally the corrected item-total correlations. An alpha below 0.70 needs explanation rather than silence. See how to analyse Likert scale data for what to do when a scale underperforms.
The assumptions evidence. Levene's test for group comparisons, Q-Q plots or Shapiro-Wilk for normality, VIF for regression. Many theses report results without showing that the tests were licensed to be used, and this is among the most common corrections requested at review.
Formatting output to APA
SPSS output is not APA format, and copying it directly is a recognisable mistake. The main adjustments:
| SPSS gives you | APA wants |
|---|---|
| Sig. = .000 | p < .001 |
| Vertical gridlines everywhere | Horizontal rules only |
| Sig. (2-tailed) | p |
| Full precision, many decimals | Two decimals for most statistics, three for p |
| Leading zeros on p and r | No leading zero: p = .03, r = .42 |
| Separate tables per procedure | One consolidated table per research question |
A practical route: set Edit > Options > Pivot Tables to the APA table look before you start, which removes much of the reformatting. Then export to Word rather than pasting screenshots — images of tables are rejected by most departments and cannot be edited during revisions.
Realistic expectations
SPSS will not tell you that you chose the wrong test. It will run an independent t-test on paired data without complaint, and a one-way ANOVA on clustered village data that violates independence. The software checks syntax, not logic.
That is why the sequence matters more than the software: research question, then design, then test selection, then assumptions, then the procedure. Our guides to choosing the right statistical test and the five steps of hypothesis testing cover the reasoning that has to happen before you open any menu. For the wider thesis process, see data analysis help for PhD scholars, and if you want the chapter built and the syntax handed over, our statistical and research data analysis service does exactly that. The UCLA SPSS learning resources provide annotated output for every procedure listed above.
Frequently Asked Questions
How do I start data analysis in SPSS for my thesis?
Set up Variable View correctly first — measure type, missing value codes, value labels. Then screen the data, run reliability on every scale, and only then run your hypothesis tests. Use Paste rather than OK so every step is recorded in a syntax file.
What does Sig. mean in SPSS output?
Sig. is the p-value. Sig. = .000 does not mean zero — it means the value is below .0005 and has been rounded to three decimals. Report it as p < .001.
How do I check normality in SPSS?
Analyze > Descriptive Statistics > Explore, then tick Normality plots with tests. This gives Shapiro-Wilk, Kolmogorov-Smirnov and Q-Q plots. For samples under about 50, Shapiro-Wilk is the more reliable test; for larger samples, trust the Q-Q plot over the p-value.
Why is Levene's test missing from my ANOVA output?
It is off by default. In the One-Way ANOVA dialog, click Options and tick "Homogeneity of variance test". If Levene's test is significant, use the Welch statistic from the same Options menu and Games-Howell post-hoc comparisons.
Should I include SPSS output in my thesis appendix?
Check your department's requirements. Many now ask for the syntax file rather than raw output, since it demonstrates reproducibility. Never paste screenshots of tables into the main text — export properly formatted tables to Word.
How do I convert SPSS output into APA format?
Change Sig. to p, remove leading zeros from p and r values, use two decimals for most statistics and three for p, replace vertical gridlines with horizontal rules, and merge related output into one table per research question. Setting the APA table look in Options before you begin saves considerable time.
Need help turning your data into defensible results? DSTechnoverse offers statistical and research data analysis services in SPSS, R, and Python — survey analysis, thesis and dissertation support, and business statistics. Get in touch to discuss your dataset.