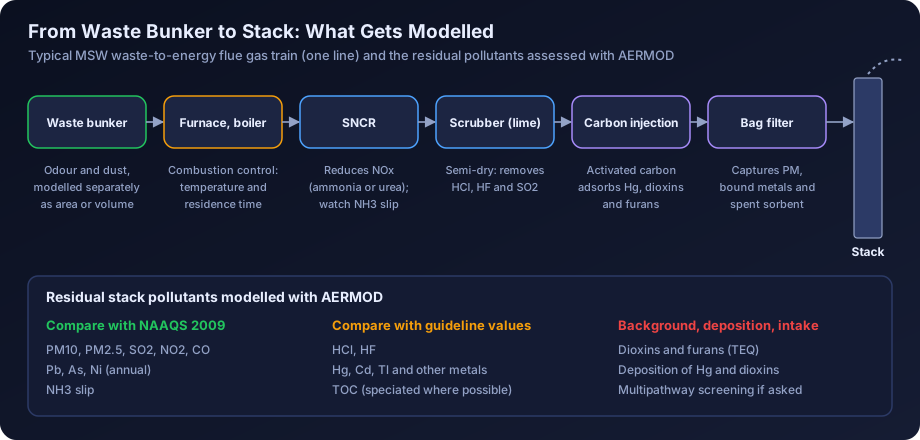
Quick answer: Air dispersion modelling for a waste-to-energy plant or incinerator in India covers the usual criteria pollutants (PM, SO2, NOx, CO) plus acid gases (HCl, HF), total organic carbon, heavy metals such as mercury, cadmium and thallium, and dioxins and furans. Criteria pollutants are compared with NAAQS 2009 after adding baseline, while trace pollutants are assessed against recognised health-based guideline values, and metals and dioxins may also need deposition modelling. The results must then be explained clearly at the public hearing, because community concern about incineration is usually higher than for other industries.
Incineration projects attract more scrutiny than almost any other industrial development of a similar size. A municipal solid waste (MSW) to energy plant, a common hazardous waste treatment, storage and disposal facility (TSDF) with an incinerator, or a common biomedical waste treatment facility is often sited close to a city, and residents tend to ask direct questions about dioxins, metals and smoke. The air quality study is the main technical answer to those questions.
This guide is for EIA consultants, municipal and private project developers, TSDF operators and EHS teams. It covers the facility types, the pollutants and standards involved, stack height rules, how to model trace pollutants and deposition in AERMOD, how to present results at a public hearing, a worked example and mitigation options.
Facility Types and Their Air Quality Issues
Four kinds of thermal waste facility are relevant in India.
| Facility | Typical waste | Typical scale | Main air quality issues |
|---|---|---|---|
| MSW waste-to-energy plant | Mixed or pre-processed municipal waste, refuse derived fuel (RDF) | Hundreds to a few thousand tonnes per day, several MW of power | Large flue gas volume, acid gases, NOx, dioxins, metals, odour from the waste bunker |
| Common hazardous waste incinerator at a TSDF | Industrial hazardous waste, spent solvents, sludges, process residues | Smaller throughput, highly variable waste composition | Acid gases including HF, metals, dioxins, combustion upsets |
| Common biomedical waste treatment facility | Incinerable biomedical waste categories | Typically small, with batch or semi-continuous feeding | Dioxins, mercury, short stacks near residential areas |
| Cement kiln co-processing | RDF, hazardous waste, alternative fuels | Within an existing cement kiln | Usually assessed with the cement plant study |
Cement co-processing deserves only a brief note here. Because the waste is burned in the main kiln, which already has a tall stack and emission controls, the air quality assessment is normally part of the cement plant study, with attention to any change in metals, HCl or organic emissions. Our guide to air quality modelling for the cement industry covers that setting.
Pollutants to Model
A complete incineration study models more pollutants than a typical industrial EIA. The list below is a practical starting point; the ToR and the waste characterisation may add more.
| Pollutant group | Examples | Comparison basis |
|---|---|---|
| Particulate matter | PM10, PM2.5 | NAAQS 2009 |
| Sulphur dioxide | SO2 | NAAQS 2009 |
| Nitrogen oxides | NOx as NO2 | NAAQS 2009 |
| Carbon monoxide | CO | NAAQS 2009 (1-h and 8-h, in mg/m³) |
| Acid gases | HCl, HF | Health-based guideline values |
| Organics | Total organic carbon (TOC), specific VOCs | Guideline values for specific substances where speciation is known |
| Heavy metals | Hg, Cd, Tl, Pb, As, Ni, Cr, Sb, Co, Cu, Mn, V | NAAQS for Pb, As and Ni; guideline values for the rest |
| Dioxins and furans | PCDD/F expressed as toxic equivalents (TEQ) | Background comparison, guideline approaches, intake-based assessment |
| Ammonia | NH3 slip from SNCR | NAAQS 2009 |
The NAAQS values most often used in these studies are PM10 at 100 µg/m³ (24-hour) and 60 µg/m³ (annual), PM2.5 at 60 and 40 µg/m³, SO2 at 80 and 50 µg/m³, NO2 at 80 and 40 µg/m³, CO at 4 mg/m³ (1-hour) and 2 mg/m³ (8-hour), lead at 1.0 µg/m³ (24-hour) and 0.5 µg/m³ (annual), arsenic at 6 ng/m³ (annual) and nickel at 20 ng/m³ (annual). For a fuller explanation of each standard and its averaging rules, see our guide to NAAQS standards in India.
CPCB Emission Standards for Incineration Facilities
India has separate emission standards for each type of thermal waste facility, all notified under the environmental laws.
- MSW waste-to-energy and incineration standards are part of the Solid Waste Management Rules, 2016. They set limits for particulate matter, acid gases, NOx, CO, TOC, metals and dioxins and furans, referenced to a standard oxygen content, and include requirements for combustion conditions.
- Common hazardous waste incinerators are covered by standards notified under the Environment (Protection) Rules, with a similar list of parameters, including HF and grouped metal limits (for example, mercury, a cadmium plus thallium group, and a group of other heavy metals).
- Biomedical waste incinerators follow the standards in the Bio-Medical Waste Management Rules, 2016, which also prescribe combustion chamber temperatures, residence time and stack height requirements.
- Cement co-processing follows the cement industry standards, which include parameters added for co-processing.
All three incineration frameworks use a dioxins and furans limit of 0.1 ng TEQ/Nm³, the same value used in European incineration rules. For other parameters, take the exact limits, averaging periods and reference conditions from the current notified text and any amendment, because they differ between facility types and have been revised over time. This guide deliberately does not reproduce the full tables.
For modelling, the useful point is that emission standards are expressed as concentrations at standard temperature and pressure, dry, corrected to a reference oxygen level (typically 11% for incinerators). To convert a limit into a mass emission rate in grams per second, multiply by the flue gas flow at the same reference conditions. Converting the flow to actual conditions for the stack exit velocity is a separate calculation, shown in the worked example below.
Stack Height Requirements
Stack height for incineration facilities comes from three places:
- Facility-specific rules. The biomedical waste rules prescribe a minimum stack height of 30 metres above ground level for incinerators. Guidelines for common hazardous waste incinerators also set a minimum height, and SPCBs commonly apply similar or higher minimums to MSW plants.
- General CPCB stack height formulas. These relate height to SO2 or particulate emission rates and are explained in our guide to stack height calculation under CPCB guidelines. For large WtE plants, the formula result can exceed the facility minimum.
- Dispersion and downwash considerations. WtE plants have large boiler houses and waste bunkers, often 30 to 50 m tall. A stack that is not well above good engineering practice height will be affected by building downwash. Our guide to AERMOD building downwash and BPIP explains how this is modelled.
In practice, the modelling study often tests two or three candidate stack heights to show how the maximum ground level concentration falls as height increases, and the final height is the one that meets all rules with an adequate margin. The relationship between height and concentration is discussed in our article on stack height and ground level concentration.
Regulatory Pathway
The applicable entry in the EIA Notification 2006 depends on the facility. Common hazardous waste TSDFs fall under item 7(d), where integrated facilities with incineration have been treated as Category A. Common biomedical waste treatment facilities and common MSW management facilities have their own entries, generally Category B, and WtE power plants have been considered under different entries depending on interpretation, capacity and fuel. General conditions, such as distance from protected areas, can also change the category. Confirm the current position from the latest consolidated notification and amendments before scoping.
Whatever the category, the ToR for an incineration project almost always asks for prediction of GLCs for criteria pollutants and for dioxins, furans, metals and acid gases, plus details of the flue gas cleaning system and continuous emission monitoring. The SPCB then uses the results at the Consent to Establish (CTE) stage. Our guide to air quality modelling for environmental clearance explains the overall process.
Modelling Trace Pollutants
Trace pollutants such as metals and dioxins are emitted in very small quantities but carry most of the public concern. The modelling method is straightforward, and the main challenge is choosing and explaining the comparison basis.
The Unit Emission Rate Approach
Because AERMOD dispersion is linear in emission rate for a given source and meteorology, you can run the model once with an emission rate of 1 g/s from the stack and scale the result for each pollutant.
- Run AERMOD for the stack with an emission rate of 1 g/s and the correct physical parameters (height, diameter, temperature, exit velocity).
- Record the maximum dispersion factor for each averaging period (1-hour, 24-hour, annual), in µg/m³ per g/s, at the maximum location and at each sensitive receptor.
- For each pollutant, multiply its emission rate in g/s by the dispersion factor.
This works for gaseous pollutants and fine particles where deposition and plume depletion are ignored. Where several stacks with different parameters exist, each stack needs its own unit run, or you can model the actual rates directly. The approach is also efficient for testing many metals with different emission rates.
Choosing Comparison Values
For lead, arsenic and nickel, compare annual averages with the NAAQS. For mercury, cadmium, thallium, antimony, chromium, cobalt, copper, manganese, vanadium, HCl and HF, there is no Indian ambient standard. Use health-based guideline values from recognised sources:
- WHO air quality guidance, which covers some metals and HF.
- Toxicological reference concentrations published by national agencies for chronic inhalation exposure, and acute values where available.
- Ambient screening values maintained by environmental regulators in other countries, which cover most metals and acid gases with separate short-term and long-term values.
Match the averaging period, add measured background where available, and report the ratio of predicted concentration to the guideline value. Chromium needs care, because guideline values for hexavalent chromium are far lower than for total chromium; state the assumption about the hexavalent fraction. Mercury needs care too, because it is emitted partly as elemental vapour and partly as oxidised and particle-bound forms that behave differently.
Dioxins and Furans
There is no Indian ambient standard for dioxins and furans, and no widely adopted ambient guideline value of the same kind as for SO2 or PM. The main human exposure route is diet, not inhalation, through deposition onto crops and pasture and accumulation in food chains. For an EIA, the usual approach is:
- Calculate the emission rate from the stack concentration (the regulatory limit or the design value) and the flue gas flow, in TEQ.
- Model the ground level air concentration with the unit emission rate approach and compare it with measured or published background levels for similar settings, using real local data where you have it.
- If the ToR or the committee asks, model deposition and estimate the contribution to dietary intake using a multipathway risk method, comparing the result with tolerable intake values published by health bodies.
The comparison with background is usually the clearest message: when the predicted increment is a small fraction of typical urban background, residents can relate to it.
Deposition of Metals and Dioxins in AERMOD
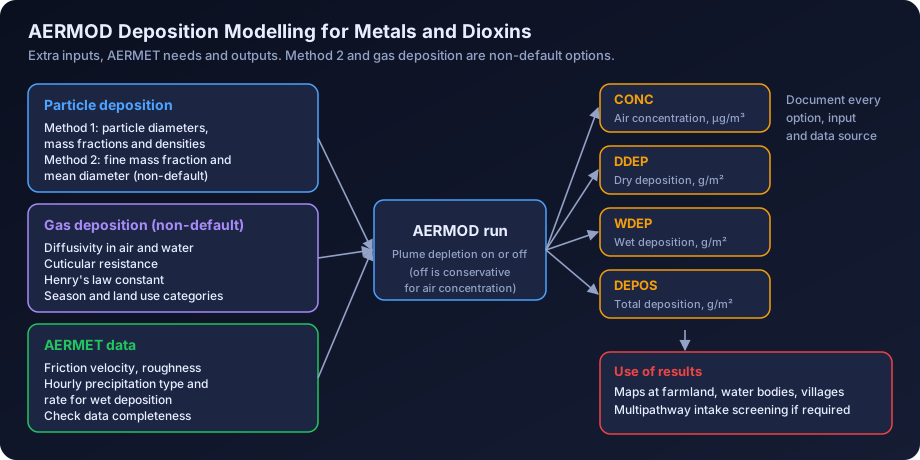
Deposition matters for metals and dioxins because the concern is accumulation in soil, water and crops rather than short-term inhalation. AERMOD can calculate dry deposition, wet deposition and total deposition, with optional plume depletion. These options need careful setup and clear documentation.
Particle Deposition
AERMOD offers two methods for particles.
- Method 1 is used when the particle size distribution is known and a significant fraction of the mass is in larger particles. For each source, you enter particle diameters, mass fractions and particle densities for a set of size categories. For an incinerator with a bag filter, the size distribution can come from stack testing on a similar plant or from published data for the control device.
- Method 2 is for cases where the size distribution is not well known and the particles are mostly fine. It needs the fraction of mass in the fine mode and a representative mean diameter. Method 2 is not part of the regulatory default options, so its use must be justified and the run must be set up with the appropriate non-default option.
Gas Deposition
Gas deposition, which is relevant for vapour-phase mercury and the vapour fraction of dioxins, is also a non-default option. It needs pollutant-specific properties (diffusivity in air and water, a cuticular resistance parameter and Henry's law constant) plus seasonal and land use information for the dry deposition velocity calculation. The values must come from published chemical property data and be documented in the report.
Meteorological Requirements
Deposition calculations need additional meteorological parameters in the AERMET output. Dry deposition depends on surface characteristics and friction velocity, which AERMET already provides, while wet deposition needs hourly precipitation type and rate. Indian surface data with complete hourly precipitation records are not always available, so check the data before committing to wet deposition. Our AERMET meteorological data guide explains the processing chain.
Outputs and Interpretation
With deposition enabled, AERMOD can report concentration, total deposition, dry deposition and wet deposition, typically as fluxes in g/m² over the averaging period. Plume depletion options reduce airborne concentrations downwind as material deposits. Leaving depletion off is conservative for air concentrations. Present deposition results as maps and as annual deposition at nearby farmland, water bodies and villages, and state which options were used and why.
A practical note on software scope: AERMOD Studio currently covers point sources on flat terrain with regulatory default options, so deposition runs and other non-default work are carried out through our consulting service.
Presenting Results at Public Hearings
Public hearings for incinerators and WtE plants are often contentious. The technical quality of the model matters, but so does the way results are explained.
| Do | Avoid |
|---|---|
| Show the location of the maximum concentration on a map with villages and landmarks | Showing only contour plots without context |
| Express results as a percentage of the standard or guideline value | Giving long lists of numbers in scientific notation |
| Compare the increment with measured baseline and with everyday sources the community knows | Claiming "zero impact" or "no emissions" |
| Explain the flue gas cleaning system and continuous monitoring simply | Avoiding questions on dioxins or metals |
| Say what happens during start-up, shutdown and upsets | Implying that the plant always operates at design conditions |
| Offer to display monitoring data publicly once the plant runs | Making commitments the operator cannot keep |
Some practical habits help:
- Translate units. Very small numbers such as femtograms per cubic metre are hard to grasp. Say what fraction of the guideline or background the plant adds.
- Use the worst case honestly. Model at the emission limit, not only the design value, so you can say that even at the legal limit the result is acceptable.
- Address odour separately. Many complaints about WtE plants concern odour from the waste bunker, transport and leachate, not the stack. Our guide to odour dispersion modelling in India explains how to assess it.
- Prepare good maps. Isopleth maps with clear legends and local landmarks are the most effective communication tool. Our article on reading AERMOD output contour maps has practical tips.
Worked Example: A 1,000 TPD MSW Waste-to-Energy Plant
The numbers in this example are illustrative only. They show the method, not the result for any real plant.
The Project
A city proposes a WtE plant with two combustion lines of 500 tonnes per day each. Flue gas cleaning on each line includes SNCR for NOx, a semi-dry scrubber with lime, activated carbon injection and a bag filter. Both flues run inside a single windshield, 70 m tall, with each flue 2.0 m in diameter.
Step 1: Flue Gas Flow
Take an illustrative specific flue gas volume of 5,000 Nm³ (dry, at 11% O2) per tonne of waste.
- Waste per line: 500 / 24 = 20.8 tonnes per hour.
- Reference flow per line: 20.8 × 5,000 = 104,000 Nm³/h, or about 28.9 Nm³/s.
To get the actual exit velocity, convert to stack conditions with an illustrative exit temperature of 140 °C, 18% moisture and 8% actual O2 (dry):
- Oxygen correction: (21 − 11) / (21 − 8) = 0.77
- Moisture: 1 / (1 − 0.18) = 1.22
- Temperature: (273 + 140) / 273 = 1.51
- Actual flow per flue: 28.9 × 0.77 × 1.22 × 1.51 ≈ 41 m³/s
- Exit velocity: 41 / (π × 1.0²) ≈ 13 m/s
Step 2: Emission Rates
Emission rate = concentration × reference flow. With two lines, the total reference flow is about 57.8 Nm³/s.
| Pollutant | Illustrative modelled concentration (at 11% O2, dry) | Total emission rate |
|---|---|---|
| Dioxins and furans | 0.1 ng TEQ/Nm³ (the regulatory limit) | about 5.8 ng TEQ/s |
| Mercury | 0.02 mg/Nm³ (illustrative design value) | about 1.16 mg/s |
| PM | 10 mg/Nm³ (illustrative design value) | about 0.58 g/s |
In a real study, every pollutant in the standard would be modelled both at the design value and at the regulatory limit.
Step 3: Unit Emission Rate Run
With the merged flues modelled as one stack and building downwash from the 40 m boiler house included, the illustrative maximum dispersion factors at 1 g/s are:
| Averaging period | Max dispersion factor (µg/m³ per g/s) | Location |
|---|---|---|
| 1-hour | 3.0 | 1.2 km SE |
| 24-hour | 0.40 | 1.5 km SE |
| Annual | 0.05 | 2.0 km SE |
Step 4: Scaled Results
- Dioxins, annual: 5.8 × 10⁻⁹ g/s × 0.05 = 2.9 × 10⁻¹⁰ µg/m³, which is about 0.29 fg TEQ/m³. This is compared with measured local background and published background ranges.
- Mercury, annual: 0.00116 g/s × 0.05 = 5.8 × 10⁻⁵ µg/m³, about 0.06 ng/m³, compared with a chronic health-based guideline value.
- PM10, 24-hour: 0.58 g/s × 0.40 = 0.23 µg/m³ incremental, added to the baseline and compared with the 100 µg/m³ NAAQS.
All of these are illustrative numbers. The value of the method is that a single model run, documented properly, supports a clear and consistent answer for every pollutant.
Step 5: Deposition
For mercury and dioxins, a separate run with particle and gas deposition gives annual deposition fluxes at the nearest farmland and a lake 3 km downwind. These feed into a screening multipathway assessment if the ToR asks for one.
Mitigation and Design Options
Modelling can test each of the following options in turn and quantify its benefit.
- Stack height. Raising the stack from 60 m to 70 or 80 m typically reduces the maximum GLC and moves it further from the site. Test this explicitly.
- Flue gas cleaning performance. Activated carbon injection rate, bag filter design and scrubber reagent dosing directly control dioxins, mercury and acid gases. Model at the design and limit values.
- Combustion control. Maintaining temperature and residence time in the secondary combustion zone, with good mixing, minimises dioxin formation. This is a design and operation measure rather than a modelling input, but the study should mention it.
- Continuous emission monitoring. CEMS for particulate, CO, HCl, SO2, NOx and other parameters, with data shared with the SPCB, supports confidence in the emission rates used.
- Bypass and upset management. Emergency bypass stacks, start-up on auxiliary fuel and interlocks that stop waste feeding when conditions are out of range all reduce the chance of high short-term emissions. The study can model an upset scenario to show its short-term impact.
- Odour control. Negative pressure in the waste bunker with bunker air used as combustion air, closed reception halls and leachate management address odour.
- Greenbelt. A greenbelt helps with fugitive dust and visual screening, though it has little effect on stack emissions.
Common Mistakes in Incinerator Modelling
- Modelling only criteria pollutants and omitting metals and dioxins that the ToR requests.
- Using the actual flow in the emission rate calculation instead of the reference flow that matches the emission standard.
- Ignoring building downwash from large boiler houses and bunkers.
- Comparing trace pollutant results with occupational limits without explanation.
- Using deposition options without documenting particle size, gas properties or precipitation data.
- Not modelling start-up or upset conditions when the committee asks about them.
Our guide to common AERMOD mistakes covers more general errors, and our QA/QC checklist for air dispersion reports helps reviewers check a report before submission.
How DSTechnoverse Helps
We carry out AERMOD studies for WtE plants, TSDF incinerators and biomedical waste facilities, including criteria pollutants, metals, acid gases and dioxins, unit emission rate scaling, deposition runs where needed, and maps suitable for public hearings. EIA consultancies can use our AERMOD modelling service on a white-label basis. For in-house screening of stack options on flat terrain, AERMOD Studio runs the real US EPA AERMOD in the browser. To discuss a project, talk to our team.
Regional guides: for local regulators, industrial areas and meteorological data in regions with active waste-to-energy projects, see AERMOD modelling in Delhi NCR and Gujarat.
Frequently Asked Questions
Which pollutants must be modelled for a waste-to-energy plant in India? At a minimum, PM10, PM2.5, SO2, NOx and CO against NAAQS 2009, plus HCl, HF, TOC, heavy metals such as mercury, cadmium and thallium, and dioxins and furans. The ToR often lists these explicitly. The pollutant list should follow the emission standards in the Solid Waste Management Rules, 2016, so that every regulated parameter has a predicted ground level concentration.
Is there an Indian ambient air standard for dioxins and furans? No. NAAQS 2009 does not include dioxins and furans. Studies usually compare predicted air concentrations with measured or published background levels and, where required, estimate deposition and dietary intake using a multipathway method, comparing the result with tolerable intake values published by health bodies. The emission limit of 0.1 ng TEQ/Nm³ applies at the stack, not in ambient air.
How do I calculate the emission rate from an emission standard? Multiply the concentration limit by the flue gas flow at the same reference conditions, usually dry, at standard temperature and pressure and corrected to 11% oxygen. Then convert to grams per second. Do not multiply by the actual flow at stack conditions, because that gives the wrong mass rate. The actual flow is used only to calculate the stack exit velocity.
What minimum stack height applies to incinerators? The Bio-Medical Waste Management Rules, 2016 prescribe a minimum stack height of 30 metres above ground for biomedical waste incinerators. Guidelines for common hazardous waste incinerators also set a minimum, and SPCBs may require more. For large WtE plants, the CPCB formula and building downwash considerations often lead to taller stacks. The model should show that the chosen height meets all applicable rules.
Does AERMOD calculate deposition of metals and dioxins? Yes. AERMOD calculates dry, wet and total deposition for particles and gases. Particle deposition Method 1 needs a particle size distribution, while Method 2 and gas deposition are non-default options that need justification and pollutant properties. Wet deposition needs hourly precipitation data processed through AERMET. All assumptions should be documented clearly in the report.
Should I model at the design emission value or the regulatory limit? Both, ideally. The design value shows expected performance, and the regulatory limit shows the worst lawful case. Presenting the limit case is especially useful at public hearings because it shows that even if the plant emits at its permitted maximum, the predicted concentrations remain acceptable compared with the standards and guideline values used.
How is a biomedical waste incinerator different from a WtE plant for modelling? Biomedical waste incinerators are much smaller, with lower flue gas flows and shorter stacks, and are often closer to housing. Building downwash and the fence line maximum matter more. Mercury and dioxins remain key pollutants. The modelling method is the same, but the receptor grid should be denser near the site and sensitive receptors such as hospitals and schools identified carefully.
How should results be explained at a public hearing? Use maps with familiar landmarks, express results as a percentage of the standard or guideline value, compare the increment with existing background levels, explain the flue gas cleaning system and continuous monitoring, and acknowledge start-up and upset conditions honestly. Avoid jargon and scientific notation where possible, and be ready to answer specific questions on dioxins, metals and odour.
Is odour from a WtE plant assessed in the same model? Odour usually comes from the waste reception hall, the bunker, vehicles and leachate rather than the stack, so it needs a separate assessment with area or volume sources and odour-specific criteria. AERMOD can model it, but the source characterisation and assessment criteria differ from those for stack pollutants, so it is presented as a separate section of the study.
Need an AERMOD study or AERMOD software? DSTechnoverse runs regulatory AERMOD modelling studies for EC, CTE and expansion applications, for industries and as a white-label partner for EIA consultancies, and provides AERMOD Studio, our AERMOD software, personalised for your firm. We are based in Indore, Madhya Pradesh and work across India. Talk to our team.
Related articles
- AERMOD Consultant in India: How to Choose, Engage and Work With an Air Dispersion Modelling Specialist
- Air Dispersion Modelling for Pharmaceutical and Chemical Plants in India
- Air Dispersion Modelling for Steel Plants in India: Sources, Pollutants and AERMOD Setup
- Air Quality Modelling for Sugar Mills and Distilleries in India