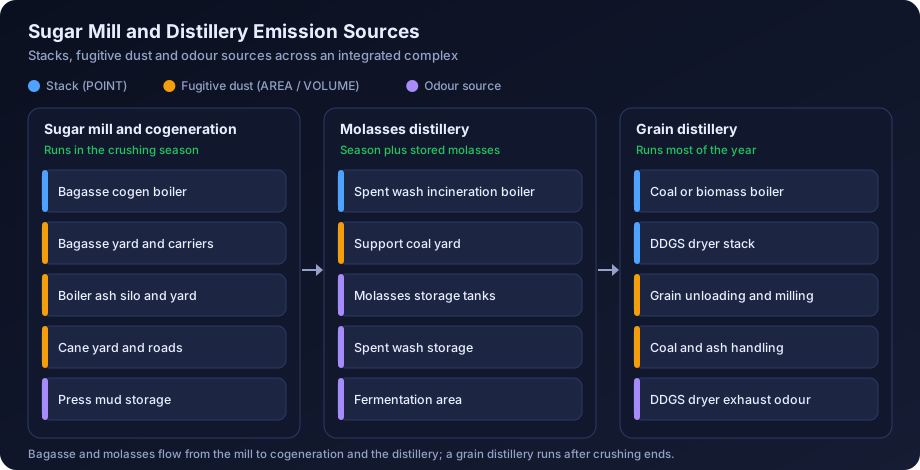
Quick answer: Air quality modelling for a sugar mill or distillery in India uses AERMOD to predict ground level concentrations of PM10, PM2.5, SO2 and NOx from the cogeneration boilers, distillery boilers, spent wash incineration boilers and dryers, plus fugitive dust from bagasse, coal and fly ash handling. Because cane crushing is seasonal while a grain distillery may run most of the year, emissions should be modelled with monthly or seasonal factors over a full year of meteorology, so that 24-hour maxima and annual averages reflect real operation. Odour from spent wash and molasses handling is usually assessed separately.
The sugar sector in India has changed shape over the last decade. A mill that once ran a crushing season with a couple of low-pressure bagasse boilers now often has a high-pressure cogeneration plant exporting power to the grid, a molasses distillery with a spent wash incineration boiler, and plans for a grain-based ethanol plant that runs well beyond the crushing season. Each of these additions needs an Environmental Clearance (EC) or consent amendment, and each needs an air quality impact assessment.
This guide explains the emission sources in an integrated sugar and distillery complex, the pollutants that matter, how to handle seasonal operation in AERMOD, what the regulator expects, a worked example for an expanding mill adding a grain distillery, and the queries that EAC, SEAC and SPCB reviewers commonly raise.
The Modern Sugar Mill and Ethanol Complex
A typical integrated complex in Maharashtra, Uttar Pradesh, Karnataka, Tamil Nadu or Gujarat now includes some or all of the following:
- Cane yard and mill house: cane unloading, preparation and milling. Air emissions are minor, but traffic and cane yard dust contribute to fugitive PM.
- Bagasse-fired boilers and cogeneration: the bagasse left after juice extraction is burnt in boilers to raise steam for the process and for turbines generating power. Older mills run several small, low-pressure boilers; modern cogeneration plants run one or two high-pressure boilers with surplus power exported to the grid.
- Bagasse storage and handling: open bagasse yards, bagasse carriers and balers. Bagasse pith is light and easily wind-blown.
- Boiler ash handling: bagasse ash (and coal ash when coal is co-fired) collected from ESP hoppers, furnace bottoms and economisers, conveyed to silos or ash yards.
- Molasses storage: steel tanks for C-heavy or B-heavy molasses, a source of odour if not well managed.
- Molasses or cane juice distillery: fermentation and distillation to produce rectified spirit, extra neutral alcohol or fuel ethanol. Spent wash is the main liquid effluent.
- Spent wash treatment: to meet zero liquid discharge (ZLD) expectations, mills use concentration followed by incineration in a dedicated boiler, biomethanation followed by composting with press mud, or concentration and drying. The incineration boiler is a significant air source.
- Grain-based distillery: broken rice, maize or other grain is milled, liquefied, fermented and distilled. Stillage is separated by decanter, the thin slop concentrated, and the solids dried into DDGS (distillers' dried grains with solubles) in a dryer. A dedicated boiler, often coal, rice husk or mixed biomass fired, supplies steam all year.
- Coal yard: when coal is used for off-season cogeneration, for the incineration boiler support fuel, or for the grain distillery boiler.
Why Distilleries Are Expanding
The Ethanol Blended Petrol programme and its E20 target drove a large wave of new and expanded distillery capacity. Sugar mills added cane juice and B-heavy molasses routes, and many added grain-based plants so that ethanol production does not stop when the crushing season ends. For modelling, this matters in two ways: the complex now has sources with different operating calendars, and the grain distillery boiler often becomes the largest year-round emission source on site.
Sources and Pollutants
| Source | AERMOD source type | Main pollutants | Typical control |
|---|---|---|---|
| Bagasse-fired cogeneration boiler | POINT | PM, NOx, CO; SO2 low from bagasse alone | ESP; wet scrubbers on older boilers |
| Boiler co-firing coal in off-season | POINT | PM, SO2, NOx | ESP; stack height |
| Spent wash incineration boiler | POINT | PM (fine, alkali-rich), SO2, NOx | ESP, sometimes with bag filter |
| Grain distillery boiler (coal, rice husk, biomass) | POINT | PM, SO2 (coal), NOx | ESP or bag filter |
| DDGS dryer | POINT | PM, odour, some VOC | Cyclone, scrubber or bag filter |
| Diesel generator sets | POINT | NOx, PM, CO | Stack height per CPCB norms; usually standby only |
| Bagasse yard and carriers | AREA or AREAPOLY | PM10, PM2.5 | Covered storage, wind barriers, sprinkling |
| Fly ash silo loading and ash yard | VOLUME or AREA | PM10, PM2.5 | Closed silos, conditioned ash, covered trucks |
| Coal yard and crusher | AREA, VOLUME | PM10, PM2.5 | Enclosure, dry fog, wind barriers |
| Internal roads and cane traffic | LINE or VOLUME series | PM10, PM2.5 | Paving, sweeping, sprinkling |
| Spent wash lagoons, compost yard, molasses tanks | AREA (odour model) | Odour, H2S, ammonia | Covered storage, controlled composting |
Some points worth stating clearly in the report:
- Bagasse is low in sulphur. SO2 from a boiler firing only bagasse is small. When coal is co-fired or used in the off-season, SO2 rises sharply, so the fuel scenario must be explicit.
- Bagasse ash is light and abrasive. PM control performance depends heavily on ESP sizing and on bagasse moisture. Older mills with wet scrubbers often have higher PM emissions than new cogeneration plants.
- Incineration boilers are different from ordinary boilers. Concentrated spent wash contains high levels of potassium and other salts, and sulphur from sulphates in the molasses. The fly ash is fine and sticky, and SO2 comes from both the spent wash and any support fuel. Use plant-specific design or monitoring data rather than a generic boiler factor.
- NOx from biomass boilers is moderate, but for completeness report it as NO2 with a documented conversion method.
For a refresher on standards, see NAAQS standards in India explained. The relevant limits for this sector are usually PM10 (100 µg/m³ 24-hour, 60 annual), PM2.5 (60 and 40), SO2 (80 and 50) and NO2 (80 and 40).
Odour: A Separate but Linked Assessment
Odour complaints near sugar mills and distilleries usually come from spent wash storage, molasses tanks, press mud and compost yards, fermentation areas and DDGS dryers, rather than from boiler stacks. Odour assessment uses AERMOD too, but with short averaging periods, peak-to-mean factors and odour unit emission rates from olfactometry or literature, and the results are compared with odour criteria rather than NAAQS. The odour dispersion modelling in India guide explains the method. In an EC report, it is good practice to keep the odour assessment as a distinct section so that it does not get mixed with the criteria pollutant results.
Sugar Mill Seasonal Operation and Its Effect on Modelling
This is the topic that most separates a good sugar sector study from a weak one.
The Operating Calendar
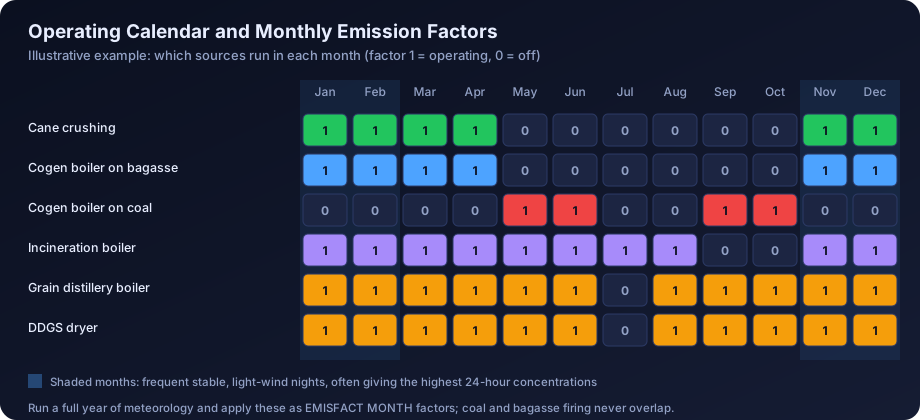
The crushing season varies by state and by cane availability, but broadly runs for several months from around October or November to March or April. During the season, bagasse boilers run at full load. Outside it, the mill house is shut, and what runs depends on the complex:
| Unit | Crushing season | Off-season |
|---|---|---|
| Bagasse cogeneration boiler | Full load on bagasse | Off, or partial load on saved bagasse or coal for power export |
| Molasses distillery and incineration boiler | Running | Often running on stored molasses until stock lasts |
| Grain distillery and its boiler | Running | Running, typically most of the year |
| DDGS dryer | Running | Running |
| Bagasse yard | Active | Stockpile shrinking; wind erosion continues |
How to Represent It in AERMOD
AERMOD can vary emission rates by month, season, hour of day and other patterns using the EMISFACT keyword. For a sugar complex, the cleanest approach is:
- Run a full year of hourly meteorology. Do not cut the met file to the crushing months. A full year is needed for the annual averages and lets the model test every day the sources actually operate.
- Apply monthly emission factors (EMISFACT with MONTH) to each source. A bagasse boiler might have a factor of 1.0 for November to April and 0 for the other months; a grain distillery boiler might have 1.0 for eleven months and 0 for a maintenance month.
- Report 24-hour maxima from the run with factors applied. The maximum 24-hour concentration will then fall on a day when the sources really operate.
- Report annual averages from the same run. These are averages over all hours of the year, including hours when seasonal sources emit nothing, which is the correct interpretation for comparison with the annual NAAQS.
- Run a conservative sensitivity case with all sources running all year at full load. If this case also complies, say so; it removes a likely review query.
Why the Season Matters for Concentrations
The crushing season in much of India overlaps with post-monsoon and winter, when nights are long, winds are often light and stable conditions are frequent. These are the conditions under which low-level and medium-height sources give their highest 24-hour concentrations. A study that assumes continuous operation will not miss this, but a study that models only the monsoon or summer months, or uses baseline monitoring done in summer, can understate the real impact.
For the same reason, baseline air quality monitoring for a sugar mill expansion is most informative when it covers part of the crushing season, so that the measured background includes the existing mill operating. If the ToR specifies a season that does not include crushing, note this in the report and explain how the existing mill's contribution was handled. See meteorological data for air modelling in India for choosing a representative year.
Regulatory Context
Sugar industry and distilleries are both listed activities in the Schedule to the EIA Notification 2006. Category and appraisal route depend on capacity, feedstock and location, and the notification has been amended several times for ethanol projects intended for blending, including changes that affect category and public consultation for some expansions. Confirm the current position for the specific project before fixing the scope.
The ToR for a sugar or distillery project normally asks for baseline monitoring, prediction of incremental concentrations with an approved model and site-specific meteorology, isopleths, and a comparison of baseline plus increment with NAAQS 2009, plus a ZLD plan for the distillery and an odour management plan. At the consent stage, the SPCB issues CTE and later CTO with stack-wise conditions that follow the modelled inventory. The air quality modelling for consent to establish guide explains what a CTE application usually needs.
CPCB Emission Standards in General Terms
CPCB has notified emission standards for boilers in the sugar industry and for distilleries under the Environment (Protection) Rules. The boiler standards set particulate matter limits that depend broadly on boiler size and type, with tighter limits for newer and larger boilers, and SPCBs often apply stricter consent limits in sensitive areas. Distillery-specific directions focus on spent wash management and ZLD, which in turn drive the design of incineration boilers. For coal-fired boilers, general boiler standards apply. Stack heights are set using CPCB formulae based on SO2 emission rate and, for smaller boilers, steam generation capacity; the stack height calculation per CPCB guidelines guide covers these. Check the latest notification and the consent order rather than relying on older values.
Emission Data
For an existing complex, use stack monitoring reports and CEMS data where installed. Large distilleries and boilers in highly polluting categories are typically required to have online monitoring linked to CPCB and SPCB servers. The stack emission monitoring data analysis guide explains how to clean and summarise this data.
For new units, use the boiler supplier's design data: flue gas flow, temperature, stack diameter and the guaranteed outlet PM concentration from the ESP or bag filter. Derive SO2 from fuel sulphur content and firing rate (bagasse, coal, rice husk and spent wash each need their own value), with any assumed retention in ash stated. For fugitive sources, use AP-42 or comparable factors with site activity data and the controls the proponent commits to. The emission inventory for dispersion modelling guide covers the general method.
A common gap is the off-season fuel. If the cogeneration boiler will run on coal for part of the year, it needs its own emission rates for that period, with a different emission factor set in AERMOD. Model it as a separate source at the same location with its own monthly factors, so that the two fuel cases never run at the same time.
Data to Collect Before Modelling
A sugar sector model goes faster when the proponent supplies the following at the start:
- A georeferenced site layout showing every stack, boiler house, distillery building, bagasse yard, coal yard, ash silo and internal road, with the plant boundary.
- Stack details for each boiler, dryer and DG set: height above ground, inner exit diameter, flue gas temperature, flow or velocity, and the control device fitted.
- Fuel data by season: bagasse quantity and moisture, coal tonnage and sulphur content, rice husk or other biomass use, and the support fuel used in the incineration boiler.
- Operating calendar: crushing days per year, distillery operating days, planned shutdown months, and whether the cogeneration plant exports power in the off-season.
- Spent wash data: quantity, solids content after concentration, and any available analysis of sulphur and ash.
- Recent stack monitoring and CEMS reports for existing units, and the current CTO with its stack-wise conditions.
- Details of committed controls: ESP fields, bag filters, covered storage, wind barriers, road paving and sprinkling frequency.
Missing fuel and calendar information is the most common reason sugar sector models are rerun, because both directly change the emission factors applied month by month.
Building Downwash and Site Layout
Sugar mills have tall boiler houses, mill houses and distillery structures, but many cogeneration stacks are well above them. Downwash is more likely to matter for the smaller stacks: DDGS dryers, older boilers, incineration boilers on compact distillery plots, and DG sets. Run BPIP-PRIME with the main buildings, and check which stacks are within the influence zone. The building downwash and BPIP guide explains the inputs.
Sugar complexes are often located in rural areas with villages close to the boundary. A fine receptor grid near the fence and discrete receptors at the nearest habitations are essential, because the fugitive dust from bagasse and ash handling has its highest impact within a few hundred metres.
Worked Example: Expanding Mill With a New Grain Distillery
The following example is illustrative. All numbers are chosen to demonstrate method and do not represent a real plant or any regulatory limit.
The Project
An existing 7,500 TCD sugar mill has a 150 TPH bagasse-fired cogeneration boiler with an ESP, and a 60 KLPD molasses distillery with a spent wash incineration boiler. It proposes to add a 250 KLPD grain-based distillery with a new coal and rice husk fired boiler, a DDGS dryer, and an expanded coal yard. The crushing season is taken as November to April (6 months). The grain distillery operates 11 months, with a shutdown in July.
Step 1: Inventory With Operating Calendar
| Source (illustrative) | Height (m) | Exit temp (K) | Velocity (m/s) | PM (g/s) | SO2 (g/s) | NOx (g/s) | Months operating |
|---|---|---|---|---|---|---|---|
| Cogen boiler, bagasse | 72 | 425 | 17 | 2.4 | 0.4 | 3.2 | Nov to Apr |
| Cogen boiler, coal (off-season, 50% load) | 72 | 420 | 10 | 1.0 | 4.5 | 1.6 | May, Jun, Sep, Oct |
| Incineration boiler (spent wash plus coal) | 55 | 430 | 14 | 0.9 | 3.8 | 1.2 | Nov to Aug |
| New grain distillery boiler | 65 | 415 | 16 | 1.1 | 5.2 | 2.1 | All except Jul |
| DDGS dryer | 30 | 360 | 12 | 0.3 | none | 0.2 | All except Jul |
| Bagasse yard (AREAPOLY) | 0 to 3 | ambient | n/a | 0.5 | none | none | All year, reduced in off-season |
| Coal yard and ash silo (AREA, VOLUME) | 0 to 15 | ambient | n/a | 0.4 | none | none | All year |
Step 2: Model Setup
- Process one full year of hourly meteorology through AERMET with appropriate surface characteristics for the irrigated cropland around the site.
- Process terrain with AERMAP, or justify flat terrain if the area is a level plain relative to stack heights.
- Run BPIP-PRIME for the boiler houses, distillery structures and the DDGS building.
- Apply EMISFACT MONTH factors to every source as per the calendar above.
- Use a nested receptor grid out to 10 km with 50 m spacing near the boundary, plus discrete receptors at the six baseline monitoring locations and the nearest villages.
- Run three scenarios: existing, proposed with seasonal factors, and a conservative case with all sources at full load all year.
Step 3: Results
| Parameter (illustrative) | Max baseline (µg/m³) | Increment, seasonal case (µg/m³) | Increment, all-year case (µg/m³) | Resultant, seasonal (µg/m³) | NAAQS (µg/m³) |
|---|---|---|---|---|---|
| PM10, 24-h | 74 | 6.8 | 7.1 | 80.8 | 100 |
| PM2.5, 24-h | 38 | 3.0 | 3.2 | 41.0 | 60 |
| SO2, 24-h | 14 | 9.6 | 12.4 | 23.6 | 80 |
| NO2, 24-h | 21 | 4.2 | 5.5 | 25.2 | 80 |
| PM10, annual | 52 (seasonal mean) | 1.6 | 2.9 | 53.6 | 60 |
Step 4: Interpretation
- The 24-hour PM10 maximum is near the bagasse yard. Fugitive bagasse dust dominates within about 300 m of the north boundary, where the nearest village lies. The seasonal and all-year results are similar because the maximum occurs on a winter day when the bagasse yard and cogen boiler are both active.
- SO2 is driven by coal. The largest SO2 increments come from the grain distillery boiler and, in the off-season, the cogen boiler on coal. The all-year case overstates SO2 because it assumes coal and bagasse firing in the cogen boiler at the same time, which cannot happen.
- The annual PM10 increment roughly halves with seasonal factors. The annual average is where seasonal modelling makes the biggest difference, and it is where the reviewer will want the basis explained.
- Baseline is reported as a seasonal mean because monitoring covered one season. Comparing it with an annual standard is approximate, and the report should say so.
Mitigation Options
| Measure | How it shows in the model | Main benefit |
|---|---|---|
| Upgrading wet scrubbers to ESPs on old bagasse boilers | Lower PM emission rate | PM10, PM2.5 |
| Additional ESP field or bag filter after ESP on incineration boiler | Lower PM emission rate, especially fines | PM2.5 |
| Raising stack height to CPCB formula value or above | Higher release, lower near-field concentration | SO2, PM, NOx |
| Combining boilers into a common multi-flue stack | Higher buoyancy and plume rise | All stack pollutants |
| Limiting coal sulphur or switching to biomass in off-season | Lower SO2 emission rate | SO2 |
| Covered bagasse storage, wind barriers, sprinkling | Lower AREA source rate | PM near the boundary |
| Closed ash silos with conditioned unloading and covered trucks | Lower VOLUME source rate | PM near the boundary |
| Paving cane yard and internal roads | Lower road emission rate | PM near the boundary |
In the illustrative example, covering part of the bagasse yard and adding wind barriers on the village side reduces the 24-hour PM10 increment at the nearest village by roughly half. Commit to measures you can monitor, because the SPCB will turn them into consent conditions.
Common Review Queries
Sugar and distillery studies tend to draw the same questions at EAC, SEAC and SPCB meetings:
- Why is the annual average lower than expected? Explain the monthly emission factors and show the all-year sensitivity case.
- What fuel will be used in the off-season? Model it explicitly with its own emission rates.
- Has the incineration boiler been modelled with realistic SO2? Show the sulphur balance for spent wash and support fuel.
- Is baseline monitoring representative of the crushing season? If not, explain how the existing mill's contribution is accounted for.
- What about odour from spent wash, compost and DDGS? Point to the odour assessment and management plan.
- Are stack heights per CPCB norms? Provide the calculation for each new stack.
- Are nearby mills or distilleries included? In dense sugar belts, a cumulative case with other units within the study area is often requested. See cumulative impact assessment modelling.
- Were fugitive sources from bagasse, ash and coal handling modelled? A stacks-only model will be questioned.
The common AERMOD mistakes guide lists further pitfalls, and the air dispersion modelling report contents guide shows how to lay out results so these answers are easy to find. For large cogeneration plants exporting substantial power, the thermal power plant modelling guide covers boiler stack issues in more depth.
How DSTechnoverse Helps
DSTechnoverse prepares AERMOD studies for sugar mills, cogeneration plants and molasses and grain distilleries, including seasonal emission factors, fuel scenarios, incineration boiler inventories, fugitive dust from bagasse and ash handling, odour assessment and mitigation cases. We also work white-label for EIA consultancies. See our AERMOD modelling service, or if your team wants to run boiler stack screening in-house, try AERMOD Studio, which covers point sources in flat terrain. For tailored setups, ask about personalised AERMOD software, or talk to our team.
Regional guides: for local regulators, industrial areas and meteorological data in sugar-producing states, see AERMOD modelling in Mumbai, Pune and Maharashtra and Bengaluru and Karnataka.
Frequently Asked Questions
Which pollutants are modelled for a sugar mill and distillery? Usually PM10, PM2.5, SO2 and NOx (reported as NO2), compared with NAAQS 2009 after adding baseline. CO may be added for large boilers if the ToR requires it. Odour is assessed separately for spent wash, molasses, compost and DDGS handling. The exact list should always follow the ToR or consent requirements issued for the project.
How should seasonal crushing operation be modelled in AERMOD? Run a full year of hourly meteorology and apply monthly emission factors to each source using the EMISFACT keyword with MONTH factors. Seasonal boilers get a factor of zero outside the crushing months. This gives realistic 24-hour maxima on operating days and correct annual averages, and a full-load sensitivity case can be added for reassurance.
Is SO2 a concern for bagasse-fired boilers? Bagasse alone has very low sulphur, so SO2 from a bagasse-only boiler is small. SO2 becomes significant when coal is co-fired or used in the off-season, in grain distillery boilers firing coal, and in spent wash incineration boilers, where sulphur in the spent wash and support fuel both contribute. Each fuel case should be modelled explicitly.
Why is the spent wash incineration boiler treated differently? Concentrated spent wash has high levels of potassium salts and sulphur compounds. The resulting fly ash is fine and sticky, which affects ESP performance, and SO2 depends on spent wash composition as well as support fuel. Generic boiler emission factors do not capture this, so plant design data or measured values should be used.
Do bagasse and ash handling need to be modelled as fugitive sources? Yes, where they are significant. Bagasse pith and boiler ash are light and easily wind-blown, and they are released at ground level, so they often dominate PM10 near the boundary and at the nearest village. Representing them as area and volume sources with committed controls gives a realistic near-field picture.
Does a grain distillery change the modelling compared with a molasses distillery? It adds a year-round boiler, often coal or biomass fired, and a DDGS dryer that emits PM and odour. Because these run outside the crushing season, they can control the annual average and off-season 24-hour concentrations. The grain storage and milling areas may also add minor fugitive dust.
Which season should baseline monitoring cover for a sugar mill expansion? Ideally part of the crushing season, so that the measured background includes the existing mill operating under the stable winter conditions that usually give the highest concentrations. Where the ToR specifies a different season, the report should explain how the existing mill's contribution was accounted for in the cumulative result.
Should several small boilers be modelled as one stack? Only if they actually discharge through a common stack. Where older mills run several low-pressure boilers with separate stacks, each should be modelled with its own location and parameters. Combining boilers into a common multi-flue stack is sometimes proposed as mitigation, because the combined buoyancy raises the plume, and AERMOD can show the benefit of that change.
Can AERMOD Studio be used for a sugar mill study? AERMOD Studio currently covers point sources in flat terrain with regulatory defaults, so it suits screening of boiler and dryer stacks and testing stack height options. Fugitive area and volume sources, terrain and seasonal factors for a full EC study are handled through the AERMOD modelling service.
Need an AERMOD study or AERMOD software? DSTechnoverse runs regulatory AERMOD modelling studies for EC, CTE and expansion applications, for industries and as a white-label partner for EIA consultancies, and provides AERMOD Studio, our AERMOD software, personalised for your firm. We are based in Indore, Madhya Pradesh and work across India. Talk to our team.
Related articles
- AERMOD Consultant in India: How to Choose, Engage and Work With an Air Dispersion Modelling Specialist
- Air Dispersion Modelling for Pharmaceutical and Chemical Plants in India
- Air Dispersion Modelling for Steel Plants in India: Sources, Pollutants and AERMOD Setup
- Air Dispersion Modelling for Waste-to-Energy Plants and Incinerators in India