
A new facility can comfortably meet air quality standards on its own — and still contribute to a genuine problem if it joins an area already crowded with other sources. That gap between "this source" and "everything together" is what cumulative impact assessment exists to close.
Why single-source studies are not enough
A standard study models one project against the standard, adding a flat background figure. But that background may not capture nearby industrial neighbours explicitly, especially planned or recently permitted ones. Regulators increasingly ask: what is the combined impact of this source and the other significant sources around it?
What cumulative modelling does
Cumulative assessment brings multiple sources into the same model run (or combines their modelled results), so the predicted concentration at each receptor reflects the total contribution — not just the project in isolation.
This typically means:
- Including other existing and permitted sources in the region as explicit emitters
- Using a realistic background for sources too distant or numerous to model individually
- Predicting the combined ground-level concentration at shared receptors
- Comparing that total against the standard
The data challenge
The hard part is not the modelling engine — it is assembling a credible multi-source inventory:
- Emission rates and stack parameters for neighbouring facilities
- Consistent coordinates and a common modelling domain
- Sensible treatment of sources at different distances
Some of this data is public; some has to be estimated from permits or emission factors. Documenting assumptions transparently is essential, because cumulative studies attract scrutiny.
Interpreting the result
Cumulative results answer a sharper question: does the airshed have room for this project? If the combined load already sits near the standard, even a small new contribution can be significant — and the assessment must say so and explore mitigation.
Why it is worth doing well
Cumulative impact assessment is where environmental credibility is won or lost, because it reflects the reality communities actually experience. It is also data-intensive and easy to under-scope. A modelling desk that regularly assembles multi-source inventories and runs combined scenarios brings both the tooling and the discipline these studies demand.
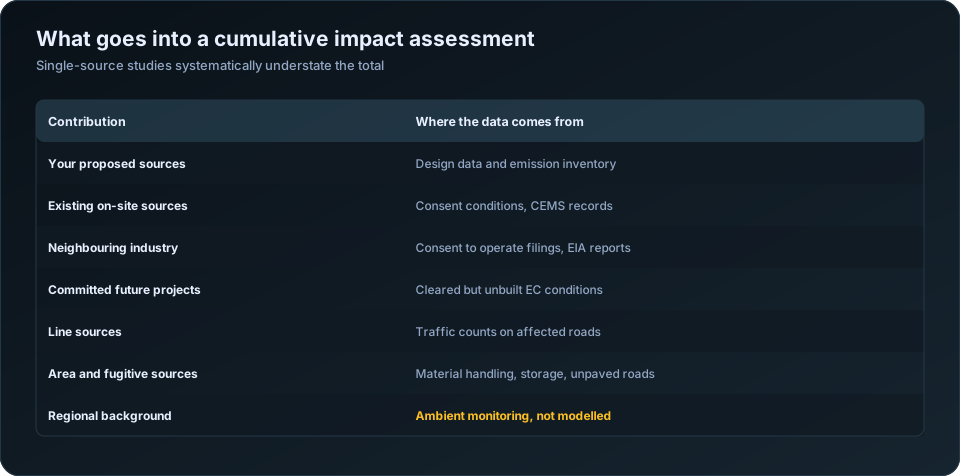
What must be counted, and where the data comes from
The defining difficulty of cumulative assessment is not modelling. It is assembling emission data for facilities that are not yours.
| Contribution | Data source | Difficulty |
|---|---|---|
| Your proposed sources | Design data and your own inventory | Straightforward |
| Existing sources on your site | Consent conditions, CEMS records | Straightforward |
| Neighbouring operating industry | Consent to Operate filings, published EIA reports | Moderate — public but scattered |
| Cleared but unbuilt projects | Environmental Clearance conditions on PARIVESH | Moderate |
| Line sources | Traffic counts on affected roads | Moderate |
| Area and fugitive sources across the area | Land use, mining plans, construction | Difficult |
| Domestic and small-scale sources | Population, fuel use surveys | Difficult |
| Regional background | Ambient monitoring — not modelled | Straightforward |
The last row is the important structural point. Regional background — long-range transport, agricultural burning, distant urban emissions, natural dust — should be represented by monitored ambient data, not by attempting to model every contributing source. Trying to model the background is both impractical and double-counts against the monitoring.
The practical boundary is therefore: model the sources you can identify individually within the study area, and add monitored background for everything else. Where you draw that line must be stated, because it determines what the assessment covers.
Avoiding double counting
This is the most common technical error in cumulative assessments, and it can push a compliant project into apparent exceedance or the reverse.
| Situation | Correct treatment |
|---|---|
| A neighbouring plant is modelled explicitly | Its contribution must be removed from, or absent in, the background |
| Background monitoring station is downwind of a modelled facility | The station already captures that facility |
| Your existing on-site sources are operating | Either model them or ensure background captures them, never both |
| Traffic modelled as line sources | Background station should not be roadside |
The cleanest way to handle this is to choose background monitoring locations that are not substantially influenced by the sources you are modelling explicitly. An upwind station, or one at a distance from all modelled facilities, gives a regional background you can add without double counting.
Where that is not possible, state the overlap and its likely magnitude. An assessment that acknowledges a conservative double count is more credible than one that quietly produces a number nobody can decompose.
Which scenarios to run
A cumulative assessment is not a single run. The scenarios answer different questions, and regulators typically want more than one.
| Scenario | Question answered |
|---|---|
| Baseline: existing sources only | What is the current situation? |
| Project alone | What does this project contribute? |
| Baseline plus project | Is the total compliant after the project? |
| Baseline plus project plus committed projects | Is there headroom for what is already cleared? |
| Future with mitigation | Does the mitigation package work? |
The fourth is the one that matters most for planning and the one most often omitted. An area may have room for your project and no room for your project plus the three others already cleared but not yet built. This is precisely the question cumulative assessment exists to answer, and it is why a project-alone study, however rigorous, does not substitute for it.
Present the scenarios as a table showing predicted increment, background, total and the standard for each. Readers can then see exactly which component drives the result.
Worst case, or realistic case?
Adding every source at maximum permitted emissions, all operating simultaneously at worst-case meteorology, produces a number that is defensible as an upper bound and often so conservative that it fails to distinguish between projects.
| Approach | When appropriate |
|---|---|
| All sources at permitted maximum | Screening; establishing an upper bound |
| Modelled sources at permitted, others via background | The usual practical compromise |
| Realistic operating rates for all | Health impact assessment |
| Worst-case meteorology across all sources | Screening only |
| Full year of meteorology, hour by hour | Refined assessment — the standard approach |
The full-year hourly approach is the correct one for refined work and handles the coincidence question properly. Sources do not all produce their maximum ground-level concentration at the same receptor in the same hour — the wind is blowing one way. Modelling every source across every hour of a real meteorological year captures when contributions genuinely coincide and when they do not, which a simple addition of individual maxima does not.
Adding each source's separate maximum is a common shortcut and is substantially over-conservative, because those maxima occur at different receptors under different wind directions.
Presenting the result usefully
The purpose is to support a decision, so the report should show where the burden comes from.
| Presentation | What it shows |
|---|---|
| Contribution table by source at key receptors | Which facility drives the concentration |
| Percentage of standard by component | How much headroom the project uses |
| Contour maps per scenario | Where the compounded impact falls |
| Incremental contribution of the project | Whether the project is material to the total |
| Sensitivity to one source being removed | Whether a single facility dominates |
The final row is often the most useful output of the whole exercise. If removing one neighbouring facility from the model drops the total below the standard, the assessment has identified something specific and actionable — which is a far better outcome than a bare exceedance finding.
For assembling your own source list see how to prepare an emission inventory; for reading the compliance result correctly, how to read AERMOD output; and for the review process, how to QA/QC an air dispersion modelling report. Our AERMOD air dispersion modelling service runs multi-source cumulative assessments. Consent and clearance documents for neighbouring facilities are available through PARIVESH, which is the practical starting point for assembling the source list.
Frequently Asked Questions
What is cumulative impact assessment in air quality?
An assessment that models the combined effect of your proposed sources together with existing industry, committed future projects, traffic and area sources, added to regional background — rather than assessing your project in isolation against the standard.
Why is a single-source study not sufficient?
Because ambient standards apply to total concentration. A project contributing 20 ug/m3 in an area already at 85 ug/m3 causes an exceedance of a 100 ug/m3 standard, while the same project in a clean area does not. Only the cumulative total answers the compliance question.
How do I get emission data for neighbouring industries?
From Consent to Operate filings held by the State Pollution Control Board, published EIA reports and Environmental Clearance conditions on the PARIVESH portal. It is public information, though assembling it takes time.
What is double counting in cumulative assessment?
Including a source both as an explicitly modelled facility and within the monitored background that already captures it. Choose background monitoring locations not substantially influenced by the sources you model, or state the overlap explicitly.
Should all sources be modelled at maximum emission rates?
At permitted maxima for regulatory assessment, but across a full year of hourly meteorology rather than at a single worst-case hour. Simply adding each source's individual maximum is substantially over-conservative, because those maxima occur at different receptors under different wind directions.
What scenarios should a cumulative assessment include?
At minimum: existing sources alone, the project alone, existing plus project, and existing plus project plus committed but unbuilt projects. The last is what reveals whether an airshed still has headroom, and it is the one most often omitted.
Need a modelling or EIA data desk without the overhead? DSTechnoverse works as a confidential, white-label subcontractor for air and water dispersion modelling and EIA data analysis. Get in touch to scope your next project.