
The most common question in data analysis is also the most consequential: which test should I use? Choose wrong and your conclusions are invalid, no matter how clean the data. Here is a practical framework.
Start with three questions
- What are you trying to find out? Comparing groups? Looking for a relationship? Predicting an outcome?
- What type is your outcome variable? Categorical (categories) or continuous (numbers)?
- How many groups or variables are involved?
Answer these and the test almost picks itself.
Comparing groups
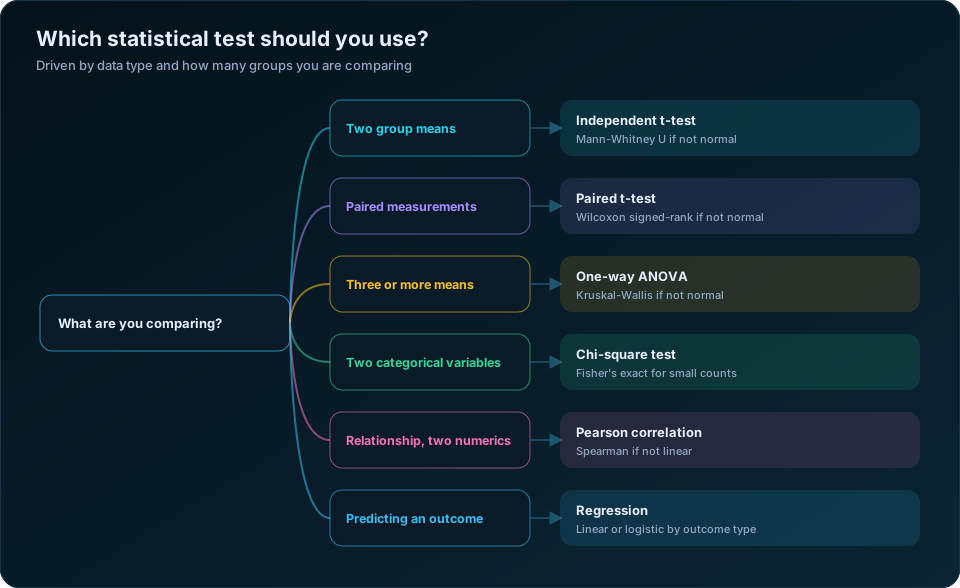
- Two groups, continuous outcome: independent-samples t-test (or paired t-test if the same subjects are measured twice)
- Three or more groups, continuous outcome: ANOVA
- Categorical outcome across groups: chi-square test
Looking for relationships
- Two continuous variables: correlation (Pearson if linear and normal; Spearman otherwise)
- Predicting a continuous outcome: linear regression
- Predicting a categorical (yes/no) outcome: logistic regression
The assumptions you cannot skip
Every test has conditions. The big ones:
- Normality — is the data roughly normally distributed? (matters for t-tests, ANOVA, Pearson)
- Homogeneity of variance — are group variances similar?
- Independence — are observations independent of each other?
If assumptions fail, use a non-parametric alternative: Mann-Whitney instead of a t-test, Kruskal-Wallis instead of ANOVA, Spearman instead of Pearson.
A quick reference
| Question | Outcome type | Test |
|---|---|---|
| 2 groups differ? | Continuous | t-test |
| 3+ groups differ? | Continuous | ANOVA |
| Categories related? | Categorical | Chi-square |
| Two numbers related? | Continuous | Correlation |
| Predict a number? | Continuous | Linear regression |
| Predict yes/no? | Categorical | Logistic regression |
When in doubt
If your design is complex — repeated measures, multiple predictors, nested data — the simple map runs out, and it is worth a conversation with an analyst before you run anything. Choosing the test before you collect data is even better: it keeps your study honest and your analysis clean.
The master reference table
Once you know your outcome type, your number of groups and whether the observations are independent, the test is almost always determined. This table covers the great majority of applied research situations.
| Your question | Outcome variable | Groups / design | Test |
|---|---|---|---|
| Is this mean different from a known value? | Continuous | One sample | One-sample t-test |
| Do two independent groups differ? | Continuous | 2 independent | Independent t-test |
| Did the same people change? | Continuous | 2 paired | Paired t-test |
| Do three or more groups differ? | Continuous | 3+ independent | One-way ANOVA |
| Do two factors both matter? | Continuous | 2 factors | Two-way ANOVA |
| Did the same people change over 3+ times? | Continuous | 3+ repeated | Repeated-measures ANOVA |
| Do groups differ after adjusting for a covariate? | Continuous | 2+ with covariate | ANCOVA |
| Are two categorical variables related? | Categorical | Any | Chi-square test of independence |
| Same, with small expected counts | Categorical | 2x2 | Fisher's exact test |
| Did the same people change their category? | Categorical | 2 paired | McNemar's test |
| Do two proportions differ? | Binary | 2 independent | Two-proportion z-test |
| Are two numeric variables related? | Continuous | — | Pearson correlation |
| Same, but not linear or not normal | Ordinal / skewed | — | Spearman correlation |
| Can I predict a numeric outcome? | Continuous | — | Linear regression |
| Can I predict a yes/no outcome? | Binary | — | Logistic regression |
| Can I predict a count? | Count | — | Poisson or negative binomial regression |
| Does time to an event differ? | Time-to-event | 2+ | Kaplan-Meier with log-rank test |
| Do clustered observations differ? | Any | Nested data | Mixed-effects / multilevel model |
Parametric and non-parametric equivalents
Every common parametric test has a rank-based counterpart that does not assume normality. When your assumption checks fail and transformation does not help, move across the row.
| Parametric test | Non-parametric equivalent | What it actually compares |
|---|---|---|
| Independent t-test | Mann-Whitney U | Distributions / median ranks |
| Paired t-test | Wilcoxon signed-rank | Median of differences |
| One-way ANOVA | Kruskal-Wallis H | Distributions across 3+ groups |
| Repeated-measures ANOVA | Friedman test | Ranked repeated measures |
| Pearson correlation | Spearman rho or Kendall tau | Monotonic association |
The trade-off is real but usually modest: non-parametric tests give up roughly 5% efficiency when the data actually are normal, and gain a great deal of robustness when they are not. For skewed variables that dominate applied work in India — household income, land holding, expenditure, waiting times — the non-parametric route or a log transformation is often the honest default.
The assumptions, and how to check each one
Choosing the right test is only half the job. Running it without checking assumptions is how the wrong answer gets a respectable-looking p-value.
| Assumption | Applies to | How to check | If it fails |
|---|---|---|---|
| Normality of residuals | t-tests, ANOVA, linear regression | Shapiro-Wilk (n < 50), Q-Q plot, histogram | Transform, or use the non-parametric equivalent |
| Equal variances | Independent t-test, ANOVA | Levene's test, boxplots | Welch's t-test or Welch's ANOVA |
| Independence | Almost everything | Study design, not a test | Mixed model or cluster-robust errors |
| Linearity | Correlation, regression | Scatterplot, residual plot | Add a polynomial term or transform |
| No severe multicollinearity | Multiple regression | VIF above 5 to 10 | Drop or combine predictors |
| Expected counts of 5 or more | Chi-square | Inspect the expected-count table | Fisher's exact test, or merge categories |
| Sphericity | Repeated-measures ANOVA | Mauchly's test | Greenhouse-Geisser correction |
| Proportional hazards | Cox regression | Schoenfeld residuals | Time-varying covariate |
Two notes that save a lot of unnecessary anxiety. First, normality applies to the residuals, not the raw variable — a skewed predictor is not itself a problem. Second, with large samples the central limit theorem makes t-tests and ANOVA quite robust to non-normality; the assumption matters most when n is small, which is exactly when Shapiro-Wilk has least power to detect a violation. Look at the Q-Q plot.
Three worked scenarios
A CSR programme evaluation. You have income data for 600 households in treatment villages and 600 in control villages, measured at baseline and endline. The naive choice is a t-test on endline income. The better choice is difference-in-differences, or ANCOVA using baseline income as a covariate — both use the baseline information that a simple t-test throws away, and both have substantially more power.
A Likert-scale satisfaction survey. Five items on a 1 to 5 agreement scale, compared across three service centres. If you are analysing a single item, it is ordinal: use Kruskal-Wallis. If the five items form a validated scale with acceptable Cronbach's alpha, the summed score is reasonably treated as continuous: use one-way ANOVA. Our guide to analysing Likert scale data covers where that line sits.
A clustered household survey. You interviewed 25 households in each of 40 villages. Households within a village are not independent, so an ordinary t-test will understate the standard errors and overstate significance. Use a mixed-effects model with village as a random effect, or survey-weighted procedures that account for the design.
That third scenario is the one most often missed. Clustering is a design feature, not a data problem, and no diagnostic test on your dataset will flag it — you have to know it is there.
When the answer is "none of these"
Some situations do not resolve to a named test, and forcing them is worse than acknowledging it:
- Very small samples, under about 15 per group, where no test has meaningful power. Report descriptives and treat it as exploratory.
- Many outcome variables with no primary hypothesis. Correct for multiple comparisons or reframe as exploratory.
- Complex nesting — students in classes in schools in districts — where a multilevel model, not a test, is the right tool.
- Time series with autocorrelation, which needs ARIMA-family methods rather than a comparison of means.
The UCLA statistical consulting group's test selector and the NIST/SEMATECH e-Handbook are both excellent free references when you land outside the common cases. For the procedure that surrounds the choice, see the five steps of hypothesis testing, and for the specific ANOVA decision, ANOVA vs t-test.
Frequently Asked Questions
How do I know which statistical test to use?
Answer three questions: what type is your outcome variable (continuous, categorical, count, time-to-event); how many groups are you comparing; and are the observations independent or paired. Those three answers narrow you to one or two candidates almost every time.
What is the difference between parametric and non-parametric tests?
Parametric tests assume the data follow a particular distribution, usually normal, and compare means. Non-parametric tests work with ranks and make far weaker assumptions, comparing distributions or medians instead. Use non-parametric when normality fails and transformation does not fix it.
Can I use a t-test for three groups?
No. Running three pairwise t-tests inflates your false-positive rate from 5% to about 14%. Use one-way ANOVA, then a post-hoc test to find which pairs differ.
Do I always need to test for normality?
Test the residuals, not the raw variable, and weigh the result against your sample size. With large samples, t-tests and ANOVA tolerate non-normality well. With small samples, a Q-Q plot is more informative than a Shapiro-Wilk p-value.
What test should I use for Likert scale data?
For a single item, treat it as ordinal and use Mann-Whitney or Kruskal-Wallis. For a multi-item scale with acceptable reliability, the summed or averaged score is commonly analysed with t-tests and ANOVA, which is widely accepted in applied research.
Which test do I use for survey data with clusters?
If your survey sampled villages, blocks or schools and then households within them, you need a method that accounts for the clustering — a mixed-effects model with the cluster as a random effect, or a survey-weighted analysis. A standard t-test will overstate your significance.
Need help turning your data into defensible results? DSTechnoverse offers statistical and research data analysis services in SPSS, R, and Python — survey analysis, thesis and dissertation support, and business statistics. Get in touch to discuss your dataset.