
Regression sounds intimidating, but the idea behind it is simple and powerful: using one or more things you know to explain or predict something you care about. Here it is without the jargon.
What regression does
Regression models the relationship between a outcome and one or more predictors. It answers questions like:
- How does advertising spend relate to sales?
- Does age predict blood pressure?
- Which factors influence customer satisfaction, and how much?
Simple linear regression
With one predictor, regression fits a straight line through your data:
outcome = intercept + slope × predictor
- The slope tells you how much the outcome changes for each one-unit increase in the predictor.
- Example: if the slope of "sales on ad spend" is 3, then every extra ₹1,000 in ads is associated with 3 more units sold.
Multiple regression
Real questions rarely have one cause. Multiple regression uses several predictors at once:
satisfaction = intercept + b₁(price) + b₂(quality) + b₃(service)
Each coefficient shows that predictor's effect while holding the others constant — which is what makes it so useful for untangling multiple influences.
Reading the output
Focus on a few things:
- Coefficients — the direction and size of each predictor's effect
- p-values — whether each predictor is statistically significant
- R-squared — how much of the outcome's variation the model explains (0 to 1)
Logistic regression
When the outcome is yes/no (bought / did not buy, passed / failed), you use logistic regression instead. It predicts the probability of the outcome and reports odds ratios.
The assumptions to respect
Linear regression assumes a linear relationship, independent observations, roughly constant error spread, and normally distributed errors. Check these — a model that violates them can mislead.
Why it is worth learning
Regression is the backbone of prediction and explanation across business, science, and social research. Once you can read a coefficient and an R-squared, a huge amount of quantitative research opens up. And when the model gets complex — many predictors, interactions, non-linearity — that is exactly where an analyst earns their keep.
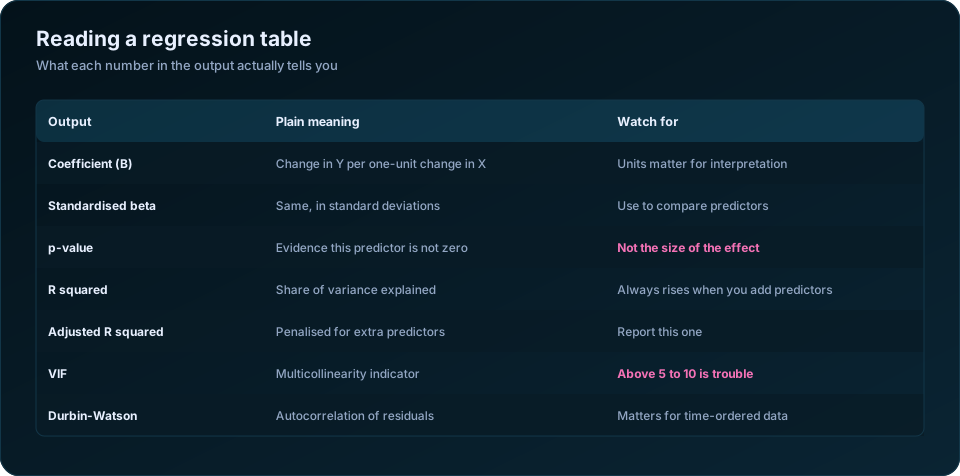
Reading the output line by line
Regression output intimidates people because it presents eight numbers at once without saying which matter. Here is what each one is telling you.
| Output | What it means | The trap |
|---|---|---|
| B (unstandardised coefficient) | Change in Y for a one-unit rise in X, holding others constant | Units matter — "per rupee" and "per lakh" look very different |
| Standard error | Precision of that coefficient | A large SE means the estimate is unstable |
| Beta (standardised) | Same effect, expressed in standard deviations | Only this one lets you rank predictors against each other |
| t and p | Evidence the coefficient is not zero | Significance is not importance |
| 95% CI | Plausible range for the true coefficient | If it spans zero, the direction is uncertain |
| R squared | Share of variance in Y explained | Rises mechanically with every predictor added |
| Adjusted R squared | Penalised for the number of predictors | Report this one |
| F statistic | Whether the model as a whole beats no model | Nearly always significant in large samples |
| VIF | How much predictors overlap | Above 5 to 10, coefficients become unreliable |
The single most useful discipline is to translate every coefficient into a sentence before writing it up. "B = 1,240 for years of education" becomes "each additional year of schooling is associated with about 1,240 rupees more monthly income, holding age, gender and district constant." If you cannot write that sentence, you have not yet understood the model.
Holding constant: what regression actually buys you
The phrase "holding others constant" is where regression earns its keep, and it is worth being precise about it.
Suppose a simple comparison shows that households with a bank account earn 30% more. That does not mean bank accounts create income — better-educated, urban, salaried households are both more likely to have accounts and more likely to earn well. Put education, location and employment type into the model and the bank-account coefficient may fall to near zero, or it may survive. Either result is informative, and neither is available from a two-group comparison.
But the control only works for variables you measured. If motivation or family wealth drives both outcomes and you did not record them, the coefficient still absorbs their effect. This is omitted variable bias, and it is the reason regression on observational data supports statements about association rather than causation. For genuine causal claims you need a design — randomisation, or difference-in-differences with baseline and endline data — not a longer list of controls.
Choosing the right regression for your outcome
| Outcome variable | Model | Coefficient is read as |
|---|---|---|
| Continuous (income, yield, score) | Linear regression | Units of Y per unit of X |
| Binary (yes/no, adopted/not) | Logistic regression | Odds ratio |
| Ordered categories (low/medium/high) | Ordinal logistic regression | Proportional odds |
| Unordered categories (crop choice) | Multinomial logistic regression | Relative risk ratio |
| Counts (visits, incidents) | Poisson or negative binomial | Rate ratio |
| Many zeros in a count | Zero-inflated model | Two processes modelled separately |
| Time until an event | Cox proportional hazards | Hazard ratio |
| Clustered or nested data | Mixed-effects model | Same, with correct standard errors |
Running linear regression on a binary outcome is the most common mismatch. It can predict probabilities above 1 and below 0, and its standard errors are wrong. Logistic regression exists precisely for this case.
Odds ratios also need care in interpretation. An odds ratio of 2.0 does not mean the outcome is twice as likely; it means the odds double, which only approximates a doubling of probability when the outcome is rare. For common outcomes, report predicted probabilities alongside the odds ratio.
The assumptions, and what to do when they fail
| Assumption | How to check | If it fails |
|---|---|---|
| Linear relationship | Scatterplot of Y against each X | Add a squared term, or transform |
| Independent residuals | Durbin-Watson; study design | Mixed model or clustered standard errors |
| Constant variance | Residuals vs fitted plot — look for a fan | Robust standard errors, or log-transform Y |
| Normal residuals | Q-Q plot of residuals | Matters little in large samples |
| No severe multicollinearity | VIF above 5 to 10 | Drop, combine, or use an index |
| No overly influential cases | Cook's distance above 4/n | Report with and without those cases |
Two clarifications that save time. Normality applies to the residuals, not to your predictors — a skewed income variable is not itself a violation. And heteroscedasticity, the fan-shaped residual plot, is extremely common in household data; robust standard errors fix it in one line in R or Stata and are worth using by default.
How many predictors can you afford?
| Predictors | Minimum sample (rule of thumb) | Comfortable sample |
|---|---|---|
| 3 | 60 | 150 |
| 5 | 100 | 250 |
| 8 | 160 | 400 |
| 12 | 240 | 600 |
| 20 | 400 | 1,000 |
The convention of 10 to 20 observations per predictor is crude but keeps people out of trouble. Logistic regression is stricter still: the binding constraint is events per variable, and you want at least 10 occurrences of the rarer outcome per predictor. A study with 500 households but only 35 adopters can support three predictors, not fifteen, regardless of the total sample size.
Resist stepwise selection. It capitalises on chance, produces different models from near-identical datasets, and yields p-values that no longer mean what they claim. Choose predictors from theory and prior evidence, then report the model you specified. See 10 common statistical mistakes in research for the company this error keeps.
Reporting a regression
A complete regression table gives, for each predictor: B with its standard error, the standardised beta, the confidence interval, and the p-value. Below it, report n, adjusted R squared, and the F test. In the text, interpret two or three coefficients in plain units and say explicitly what was held constant.
For the surrounding decisions see how to choose the right statistical test and how to present statistical results. The UCLA regression resources give annotated output for every model named here, and our statistical and research data analysis service covers model specification and diagnostics for thesis and consulting work.
Frequently Asked Questions
What does regression analysis actually tell you?
It estimates how much an outcome changes when a predictor changes by one unit, while holding the other predictors in the model constant. It quantifies association and supports prediction; it demonstrates causation only when the study design supports that claim.
What is a good R squared value?
It depends entirely on the field. Predicting a physical process might expect 0.90; predicting human behaviour from survey data, 0.20 to 0.40 is often respectable. A low R squared with meaningful, well-estimated coefficients can still be a useful model.
What is the difference between linear and logistic regression?
Linear regression predicts a continuous outcome and returns coefficients in the units of that outcome. Logistic regression predicts a binary outcome and returns odds ratios. Using linear regression on a yes/no outcome produces impossible predicted probabilities and incorrect standard errors.
How many variables can I include in a regression?
Roughly one predictor per 10 to 20 observations. For logistic regression, count events rather than observations — you want at least 10 occurrences of the rarer outcome per predictor.
What is multicollinearity and why does it matter?
It occurs when predictors are highly correlated with each other, so the model cannot separate their individual effects. Coefficients become unstable and standard errors inflate. Check VIF; above 5 to 10, drop one variable or combine them into an index.
Does a significant regression coefficient prove causation?
No. It shows an association that persists after adjusting for the other variables in the model. Unmeasured confounders can still explain it. Causal claims require a design such as randomisation, an instrumental variable, or a credible difference-in-differences setup.
Need help turning your data into defensible results? DSTechnoverse offers statistical and research data analysis services in SPSS, R, and Python — survey analysis, thesis and dissertation support, and business statistics. Get in touch to discuss your dataset.