
Behind almost every statistical test lies the same logic: hypothesis testing. Once you understand its five steps, t-tests, ANOVA, chi-square, and regression all start to make sense as variations on one theme.
Step 1: State your hypotheses
Every test starts with two competing statements:
- Null hypothesis (H₀): there is no effect or no difference. This is the default you try to disprove.
- Alternative hypothesis (H₁): there is an effect or a difference. This is usually what you actually believe.
Example: H₀ — "the training has no effect on scores." H₁ — "the training changes scores."
Step 2: Choose your significance level
Set your threshold for evidence before looking at results — usually alpha = 0.05. This is the risk you accept of wrongly rejecting a true null hypothesis (a false positive).
Step 3: Select and run the right test
Pick the test that matches your question and data type:
- Comparing two group means → t-test
- Comparing 3+ means → ANOVA
- Categorical associations → chi-square
- Relationships → correlation or regression
Then check the test's assumptions and run it.
Step 4: Compare the p-value to alpha
The test produces a p-value. Compare it to your significance level:
- p < 0.05 → reject the null hypothesis (evidence of an effect)
- p ≥ 0.05 → fail to reject the null (insufficient evidence)
Note the careful language: you never "prove" the null true — you only fail to reject it.
Step 5: Interpret in context
A p-value alone is not a conclusion. Report the effect size to show magnitude, consider whether the result is practically meaningful, and state it in the language of your research question.
The two errors to remember
- Type I error — rejecting a true null (a false positive)
- Type II error — failing to reject a false null (a missed effect)
Your significance level controls Type I risk; your sample size and power control Type II risk.
A worked example, start to finish
Abstractions only get you so far. Here is the whole procedure on a real question: a retail chain in Indore redesigns its checkout page and wants to know whether the new version converts better.
The setup. Old page: 4,100 visitors, 246 purchases (6.0%). New page: 4,050 visitors, 292 purchases (7.2%). The new page looks better. Is that difference real, or the kind of wobble you would see anyway?
Step 1 — hypotheses. H0: the two pages convert at the same rate. H1: they do not. Note that H1 is two-sided; we care about a difference in either direction, because a redesign that quietly hurt conversion would matter just as much.
Step 2 — significance level. Alpha is set at 0.05 before looking at the data. This is a low-stakes commercial decision, so the conventional threshold is appropriate. A drug trial would use something stricter.
Step 3 — the test. Two independent groups, one binary outcome (purchased or not). That points to a two-proportion z-test, or equivalently a chi-square test of independence. Both give the same answer here.
Step 4 — the result. The pooled proportion is 6.6%, the standard error of the difference is about 0.0055, and the observed difference of 1.2 percentage points gives z = 2.18, p = 0.029.
Step 5 — interpretation. p is below 0.05, so we reject H0. But the sentence that belongs in the report is not "p = 0.029". It is: the new page converted 1.2 percentage points higher (7.2% vs 6.0%), a 20% relative lift, 95% CI [0.1, 2.3] percentage points. That confidence interval is the useful part. It tells the business the true lift is probably somewhere between "barely worth it" and "clearly worth it" — which is honest, and which a bare p-value hides completely.
Power: the step most researchers skip
Steps one to five tell you what to do with the data you have. Power analysis tells you whether the data you are about to collect can answer the question at all.
Power is the probability that your test detects a real effect. The convention is 80%, which means that even a well-designed study misses a genuine effect one time in five. Run an underpowered study and you are not being cautious — you are buying a coin flip with your research budget.
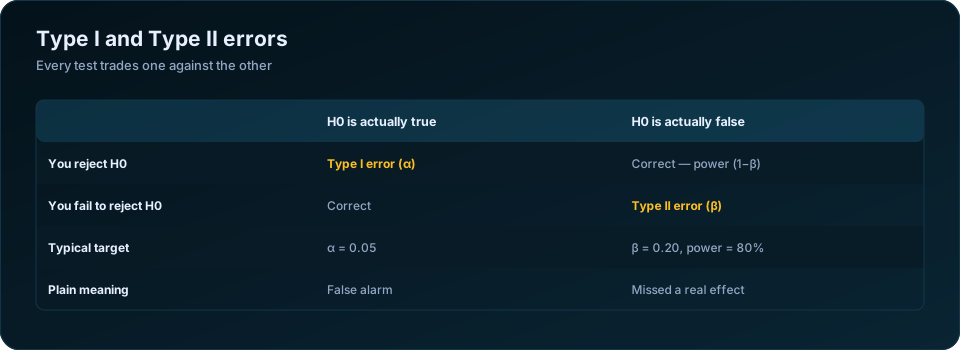
The two errors trade against each other, and both are decisions you make rather than accidents that befall you:
| H0 actually true | H0 actually false | |
|---|---|---|
| You reject H0 | Type I error — false alarm (probability alpha) | Correct detection (probability = power) |
| You fail to reject H0 | Correct | Type II error — missed effect (probability beta) |
Lowering alpha from 0.05 to 0.01 makes false alarms rarer but missed effects more common. The only way to reduce both at once is to increase the sample size — which is exactly why sample size calculation belongs at the design stage, not the analysis stage.
A related trap: a non-significant result in an underpowered study is not evidence of no effect. It is evidence of nothing at all. "Absence of evidence is not evidence of absence" is a cliche precisely because researchers keep forgetting it.
One-tailed or two-tailed?
A two-tailed test asks "is there a difference?". A one-tailed test asks "is it bigger?" and treats any result in the other direction as a non-finding.
One-tailed tests have roughly 20% more power at the same sample size, which makes them tempting. Use one only when a result in the opposite direction would genuinely be irrelevant to your decision — and declare it in advance. Switching to a one-tailed test after seeing which way the data leaned is a well-documented form of cheating, and reviewers look for it.
| Situation | Choose |
|---|---|
| Comparing two treatments with no strong prior | Two-tailed |
| Testing whether a new method beats an established one, where "worse" changes nothing | One-tailed, declared in advance |
| Regulatory submission | Two-tailed, almost always |
| You already looked at the data | Two-tailed — the choice is no longer yours to make |
When you run many tests at once
Test twenty independent hypotheses at alpha = 0.05 and you expect one false positive by chance alone. Run a survey with sixty cross-tabulations and the arithmetic becomes uncomfortable.
| Correction | How it works | When to use it |
|---|---|---|
| Bonferroni | Divide alpha by the number of tests | Few planned comparisons; simple and conservative |
| Holm | Sequential Bonferroni | Strictly better than Bonferroni — prefer it |
| Benjamini-Hochberg | Controls the false discovery rate | Exploratory work with many tests |
| Pre-registration | Name your primary outcome in advance | The strongest protection of all |
The single most effective control is not statistical at all: decide before collecting data which one or two comparisons are primary, and label everything else exploratory in the write-up.
How to report a hypothesis test
Journals and reviewers look for the same elements every time. A complete report includes:
| Element | Example |
|---|---|
| Test used and why | "Independent-samples t-test; Levene's test non-significant" |
| Test statistic with df | t(148) = 2.61 |
| Exact p-value | p = 0.010 (not "p < 0.05") |
| Effect size | Cohen's d = 0.43 |
| Confidence interval | 95% CI [0.12, 0.74] |
| Direction, in plain words | "Trained enumerators recorded 4.2 more complete responses per day" |
Report exact p-values rather than thresholds, and never write "p = 0.000" — that is SPSS rounding, and the correct form is p < 0.001. For the wider set of pitfalls, see our guide to common statistical mistakes in research, and for choosing the test itself, how to choose the right statistical test.
The American Statistical Association's statement on statistical significance is six principles long and worth the ten minutes. The NIST/SEMATECH e-Handbook of Statistical Methods is the reference to keep open while you work.
The takeaway
Hypothesis testing is a disciplined way of asking, "is this result more than chance?" State clear hypotheses, set your threshold in advance, run the right test, and interpret honestly with effect sizes. Master these five steps and the whole field of inferential statistics becomes far less mysterious.
Frequently Asked Questions
What are the 5 steps of hypothesis testing?
State the null and alternative hypotheses; choose a significance level (usually 0.05) before seeing the data; select and run the appropriate test for your data type and design; compare the p-value against your chosen alpha; and interpret the result in context, with an effect size and confidence interval rather than a bare verdict.
Can you accept the null hypothesis?
No. You either reject H0 or fail to reject it. Failing to reject means the data did not provide enough evidence against H0 — not that H0 is true. If you genuinely need to demonstrate "no meaningful difference", use an equivalence test, which is designed for that purpose.
What is a good p-value?
There is no such thing as a good p-value in isolation. p = 0.04 in a study of 10,000 people may reflect a trivial effect, while p = 0.08 in a study of 40 may point to something important that was simply underpowered. Always read the p-value alongside the effect size and confidence interval.
What is the difference between alpha and the p-value?
Alpha is the threshold you set in advance — your tolerance for a false positive. The p-value is what the data produced. You compare one to the other. Choosing alpha after seeing the p-value defeats the entire logic of the procedure.
How large should my sample be for hypothesis testing?
That depends on the smallest effect you would care about, the variability in your data, and the power you want. As a rough anchor, detecting a medium effect (d = 0.5) between two groups at 80% power needs about 64 participants per group; a small effect (d = 0.2) needs roughly 394. Our sample size guide works through the calculation.
Do I need a statistician to run a hypothesis test?
Not for a simple two-group comparison. You do want help when the design involves clustering, repeated measurements, many covariates, or a regulatory submission where the analysis will be scrutinised. Our statistical and research data analysis service covers exactly those cases.
Need help turning your data into defensible results? DSTechnoverse offers statistical and research data analysis services in SPSS, R, and Python — survey analysis, thesis and dissertation support, and business statistics. Get in touch to discuss your dataset.