
Two of the most common tests in research both compare group means — so which do you use? The rule is refreshingly simple, but the reason behind it matters.
The simple rule
- Two groups? Use a t-test.
- Three or more groups? Use ANOVA.
That is the headline. Now the detail.
The t-test
A t-test compares the means of two groups to see if they differ more than you would expect by chance.
Varieties:
- Independent-samples t-test — two separate groups (e.g. men vs women)
- Paired t-test — the same subjects measured twice (e.g. before vs after)
- One-sample t-test — one group compared against a known value
ANOVA
ANOVA (Analysis of Variance) compares the means of three or more groups at once.
Why not just run several t-tests? Because each test carries a chance of a false positive, and running many multiplies that risk. ANOVA tests all groups together in one shot, controlling that error.
Varieties:
- One-way ANOVA — one grouping factor (e.g. three teaching methods)
- Two-way ANOVA — two factors at once (e.g. method × gender)
- Repeated-measures ANOVA — the same subjects across multiple conditions
The catch: ANOVA tells you that, not which
A significant ANOVA says "at least one group differs" — but not which ones. To find out, you run post-hoc tests (like Tukey's HSD) that compare the groups pairwise while controlling error.
Shared assumptions
Both tests assume:
- Normality of the outcome within groups
- Homogeneity of variance across groups
- Independence of observations
If normality fails, use non-parametric alternatives: Mann-Whitney (instead of t-test) or Kruskal-Wallis (instead of one-way ANOVA).
Quick reference
| Groups | Same or different subjects | Test |
|---|---|---|
| 2 | Different | Independent t-test |
| 2 | Same (twice) | Paired t-test |
| 3+ | Different | One-way ANOVA |
| 3+ | Same | Repeated-measures ANOVA |
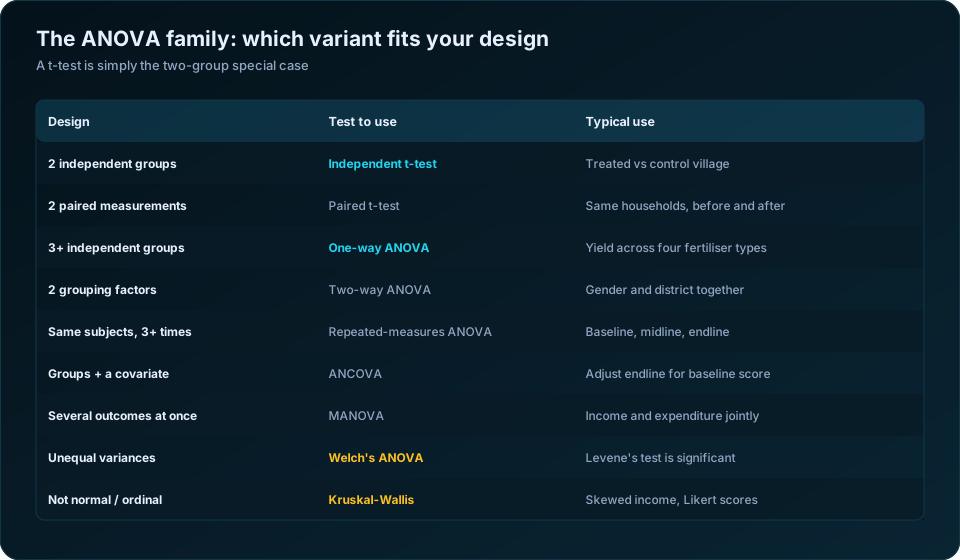
The whole ANOVA family, not just one-way
"ANOVA" is a family, and picking the wrong member is a more common error than picking ANOVA over a t-test in the first place.
| Your design | The right member | A concrete example |
|---|---|---|
| Two independent groups | Independent t-test | Treated village vs control village |
| Two paired measurements | Paired t-test | The same households before and after |
| Three or more independent groups | One-way ANOVA | Crop yield under four fertiliser types |
| Two grouping factors at once | Two-way ANOVA | District and gender together |
| Same subjects measured 3+ times | Repeated-measures ANOVA | Baseline, midline and endline scores |
| Groups plus a continuous covariate | ANCOVA | Endline score adjusted for baseline score |
| Several related outcomes together | MANOVA | Income and expenditure jointly |
| Unequal variances between groups | Welch's ANOVA | Levene's test came back significant |
| Non-normal or ordinal outcome | Kruskal-Wallis | Skewed income, single Likert items |
Two of these deserve emphasis because they are routinely under-used in applied work.
Two-way ANOVA and the interaction term. If you have two factors, running two separate one-way ANOVAs discards the most interesting question: does the effect of one factor depend on the other? A training programme might raise incomes substantially for landless households and barely at all for landowners. Two separate tests would report a modest average effect and miss the story entirely. The interaction term is where that story lives.
ANCOVA over change scores. When you have baseline and endline measurements, analysing the change score is intuitive but statistically weaker than ANCOVA with baseline as a covariate. ANCOVA has more power and handles regression to the mean properly. This matters for anyone running baseline and endline impact evaluations.
Post-hoc tests: which pairs actually differ
A significant ANOVA tells you that at least one group differs from at least one other. It does not tell you which. That is what post-hoc tests are for — and running unadjusted t-tests instead re-introduces exactly the multiple-comparison problem ANOVA was protecting you from.
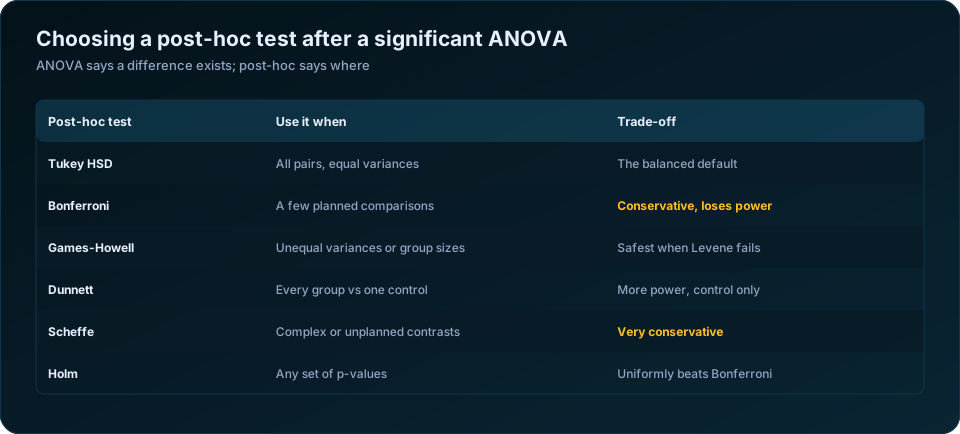
| Post-hoc test | Use it when | The trade-off |
|---|---|---|
| Tukey HSD | Comparing all pairs, equal variances, similar group sizes | The balanced default choice |
| Games-Howell | Unequal variances or unequal group sizes | The safest option when Levene's test fails |
| Bonferroni | A small number of planned comparisons | Conservative; loses power as comparisons multiply |
| Holm | Any set of p-values | Uniformly more powerful than Bonferroni, same protection |
| Dunnett | Every treatment group against one control | More power because it tests fewer pairs |
| Scheffe | Complex or unplanned contrasts | Very conservative; rarely the best fit |
A practical rule: run Levene's test first. Equal variances point to Tukey; unequal variances point to Welch's ANOVA followed by Games-Howell. If your design is "several treatments versus one control", Dunnett is the efficient choice and will find differences the others miss.
Effect size: the number ANOVA output buries
An F-statistic and a p-value tell you whether groups differ. They say nothing about how much. Every reported ANOVA should carry an effect size.
| Statistic | Used with | Small | Medium | Large |
|---|---|---|---|---|
| Cohen's d | t-test | 0.20 | 0.50 | 0.80 |
| Eta squared | One-way ANOVA | 0.01 | 0.06 | 0.14 |
| Partial eta squared | Factorial ANOVA | 0.01 | 0.06 | 0.14 |
| Omega squared | ANOVA, less biased | 0.01 | 0.06 | 0.14 |
Eta squared is the proportion of variance in the outcome explained by the grouping. An eta squared of 0.03 with p = 0.01 means a statistically detectable difference that accounts for 3% of the variation — a finding worth reporting precisely, and worth not overselling. Omega squared is the less biased estimator and is preferable in small samples, though partial eta squared is what SPSS reports by default.
A worked comparison
A programme trains enumerators using three different methods and measures completed interviews per day.
| Method | n | Mean per day | SD |
|---|---|---|---|
| Classroom only | 22 | 11.4 | 2.6 |
| Classroom plus field practice | 24 | 14.1 | 2.9 |
| Field practice plus daily feedback | 21 | 15.2 | 3.1 |
One-way ANOVA gives F(2, 64) = 10.3, p < 0.001, eta squared = 0.24. Levene's test is non-significant, so Tukey HSD is appropriate. It reports that both practice-based methods beat classroom-only (p = 0.004 and p < 0.001), while the two practice-based methods do not differ significantly from each other (p = 0.42).
That is the useful conclusion, and no single t-test would have produced it: field practice is what matters, and the daily feedback adds little on top. The 24% of variance explained is substantial, and the recommendation follows directly. Our guide to training enumerators covers what that finding implies in practice.
Reporting formats
| Test | Standard reporting format |
|---|---|
| Independent t-test | t(48) = 2.61, p = 0.012, d = 0.74, 95% CI [0.6, 4.5] |
| Paired t-test | t(29) = 3.14, p = 0.004, d = 0.57 |
| One-way ANOVA | F(2, 64) = 10.3, p < 0.001, eta squared = 0.24 |
| Two-way ANOVA | Interaction: F(2, 180) = 4.7, p = 0.010, partial eta squared = 0.05 |
| Welch's ANOVA | F(2, 41.2) = 8.9, p = 0.001 — note the fractional df |
| Kruskal-Wallis | H(2) = 12.4, p = 0.002 |
Report degrees of freedom in both positions for ANOVA — between-groups and within-groups — because a reader cannot reconstruct your sample size otherwise. Welch's ANOVA produces fractional denominator degrees of freedom, which is expected and should not be rounded away.
For the assumption checks behind all of this, see choosing the right statistical test; for how the p-values should be read, the p-value explained. If you are running these in SPSS for a thesis, SPSS data analysis for your thesis walks through the menus, and the UCLA statistics resources give annotated output for every procedure named here.
The takeaway
Count your groups, check your assumptions, and pick accordingly — then remember that a significant ANOVA is an invitation to look closer with post-hoc tests, not a finish line.
Frequently Asked Questions
When should I use ANOVA instead of a t-test?
Use a t-test for exactly two groups and ANOVA for three or more. A t-test is mathematically the two-group special case of ANOVA — with two groups, F equals t squared and both give identical p-values.
Why can I not just run multiple t-tests?
Each test carries a 5% false-positive risk. Three pairwise tests raise the overall risk to roughly 14%, and six tests to about 26%. ANOVA followed by a post-hoc test controls that inflation.
What is the difference between one-way and two-way ANOVA?
One-way has a single grouping factor. Two-way has two, and additionally tests whether they interact — whether the effect of one factor depends on the level of the other. The interaction is usually the most informative part of the output.
Which post-hoc test should I use?
Tukey HSD when variances are roughly equal and you want all pairwise comparisons. Games-Howell when Levene's test is significant or group sizes are very unequal. Dunnett when every group is being compared to a single control.
What do I do if my ANOVA assumptions are violated?
For unequal variances, use Welch's ANOVA with Games-Howell post-hocs. For serious non-normality with small samples, use Kruskal-Wallis. For repeated measures failing sphericity, apply the Greenhouse-Geisser correction.
Do I need to report effect size with ANOVA?
Yes, and most journals now require it. Report eta squared, partial eta squared or omega squared. A significant F with a very small effect size is a real but minor difference, and readers cannot tell the two apart from the p-value alone.
Need help turning your data into defensible results? DSTechnoverse offers statistical and research data analysis services in SPSS, R, and Python — survey analysis, thesis and dissertation support, and business statistics. Get in touch to discuss your dataset.