
"Strongly agree" to "strongly disagree" — the Likert scale is the most common measurement in survey research. It is also one of the most commonly mishandled. Here is how to analyse it properly.
First: item vs scale
A crucial distinction:
- A Likert item is a single question (one statement, one response).
- A Likert scale is several related items combined into one measure.
How you analyse the data depends on which you have.
Analysing single Likert items
A single item produces ordinal data — ordered categories, but the gaps between them are not necessarily equal. For single items, prefer:
- Frequencies and percentages for each response option
- Median and mode as the central tendency (not the mean)
- Bar charts or diverging stacked bars to visualise
- Non-parametric tests — Mann-Whitney, Kruskal-Wallis, Spearman
Analysing Likert scales (combined items)
When you sum or average several items into a scale, the result behaves more like continuous data — and this is widely accepted in practice. For scales you can:
- Compute a mean scale score per respondent
- Use parametric tests — t-tests, ANOVA, correlation, regression
- Report the mean and standard deviation
Always check reliability first
Before combining items into a scale, confirm they belong together. Compute Cronbach's alpha; a value around 0.70 or above suggests the items measure the same underlying construct. Without this check, your scale score may be meaningless.
The mean debate — kept practical
Statisticians argue about whether you can take the mean of ordinal Likert data. The pragmatic consensus:
- Single item → treat as ordinal (median, non-parametric)
- Multi-item scale with good reliability → treat as continuous (mean, parametric)
Common mistakes to avoid
- Taking the mean of a single item as if the gaps were equal
- Building a scale without checking reliability
- Using parametric tests on a single ordinal item with a small, skewed sample
- Ignoring neutral midpoints and what they might mean
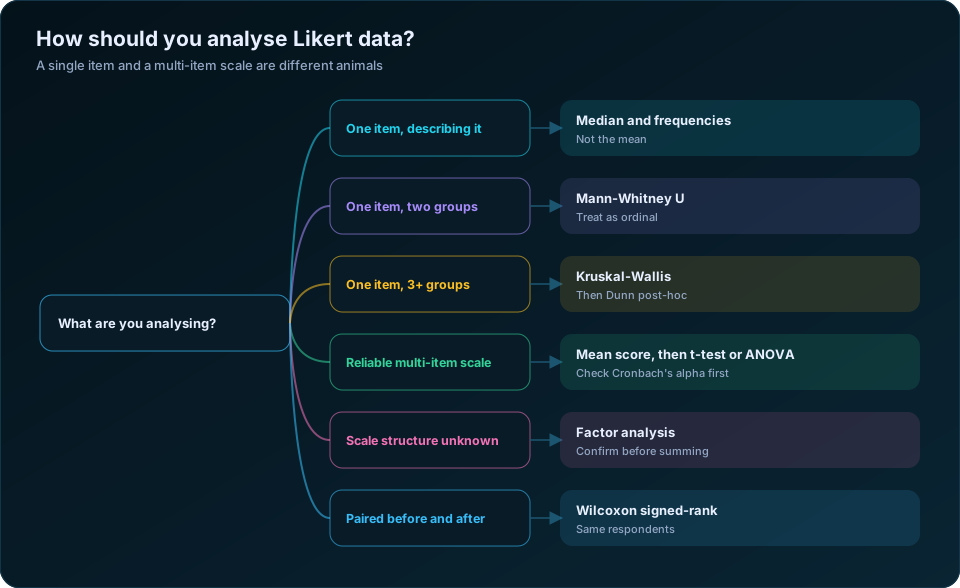
The decision that settles everything
Almost every argument about Likert analysis dissolves once you answer one question: are you analysing a single item, or a validated multi-item scale?
| You have | Data type | Describe with | Compare with |
|---|---|---|---|
| One item, standalone | Ordinal | Median, mode, frequency table | Mann-Whitney U, Kruskal-Wallis |
| One item, paired before and after | Ordinal | Median change | Wilcoxon signed-rank |
| Several items measuring one construct | Approximately interval | Mean, SD | t-test, ANOVA, regression |
| Several items, structure unverified | Unknown | Nothing yet | Run factor analysis first |
"Would you recommend this service?" on its own is a single ordinal item. The distance between "agree" and "strongly agree" is not guaranteed to equal the distance between "neutral" and "agree", so the mean is not strictly meaningful. Report the median and, better still, the full distribution.
But five items measuring workplace satisfaction, summed or averaged into a single score, behave very differently. The composite takes many more possible values, its distribution is usually close to normal, and decades of simulation work show that parametric tests on such scores perform well. This is why the "you can never take a mean of Likert data" position, though technically correct about single items, is misleading about how applied research actually works.
Check reliability before you combine anything
Averaging five items assumes they measure the same thing. Cronbach's alpha tests that assumption, and running it takes one minute.
| Alpha | Verdict | Action |
|---|---|---|
| Below 0.50 | Unacceptable | Do not combine — the items measure different things |
| 0.50 to 0.69 | Questionable | Inspect item-total correlations; likely a dimensionality problem |
| 0.70 to 0.79 | Acceptable | Standard threshold for research use |
| 0.80 to 0.89 | Good | Comfortable for most purposes |
| 0.90 and above | Excellent, or redundant | Above 0.95, items may be near-duplicates |
Two things to check alongside the headline number. The item-total correlation for each item should exceed about 0.30; anything lower is not contributing. And the alpha if item deleted column tells you whether dropping one item would improve the scale — if removing item 4 lifts alpha from 0.62 to 0.81, item 4 does not belong.
The most common cause of a catastrophically low alpha is an unreversed negative item. If your scale mixes "I enjoy my work" with "I find my work draining", the second must be reverse-scored before anything else happens. See how to clean survey data before analysis for where this sits in the workflow, and reliability and validity in survey research for what alpha does and does not prove.
Presenting Likert results so people actually read them
A table of means is the least informative way to present agreement data, because it hides polarisation. A mean of 3.0 could mean everyone was neutral, or that half the respondents strongly agreed and half strongly disagreed — opposite findings with identical means.
| Presentation | Shows | Best for |
|---|---|---|
| Diverging stacked bar chart | Full distribution, split at neutral | The default choice for reporting |
| Top-two-box percentage | Share agreeing or strongly agreeing | Executive summaries and dashboards |
| Frequency table with percentages | Every category | Appendices and detailed reports |
| Median with interquartile range | Central tendency, robustly | Single-item ordinal reporting |
| Mean with SD | Central tendency and spread | Validated multi-item scales only |
| Net agreement score | Agree minus disagree | Tracking one number over time |
The diverging stacked bar — negative responses extending left from a centre line, positive responses right — is the single most effective format for Likert data and is worth the effort of building. It makes polarisation visible at a glance, which no summary statistic does.
Five points, seven points, or a forced choice?
| Design | Effect |
|---|---|
| 5-point scale | Familiar, fast, translates well; the default for field surveys |
| 7-point scale | Slightly better reliability and discrimination; more cognitive load |
| 10 or 11-point | Common in NPS-style work; respondents cluster at round numbers |
| No neutral midpoint | Forces a direction; risks frustrating genuinely neutral respondents |
| Separate "don't know" option | Keeps genuine non-opinion out of the neutral category |
For household surveys conducted in local languages, five points is usually the right call — seven distinct verbal anchors are hard to translate consistently and harder for respondents to hold in mind during a face-to-face interview. Always offer "don't know" as a separate option rather than letting it hide inside "neutral"; these are different responses and merging them corrupts the middle of your distribution.
The mistakes that show up in review
| Mistake | Why it fails |
|---|---|
| Averaging items that were never tested for reliability | The composite may be measuring two different things |
| Reporting a mean for a single item without noting it is ordinal | Technically indefensible, easily avoided |
| Forgetting to reverse-score negative items | Destroys alpha and inverts the finding |
| Running a chi-square on a 5 × 4 table with tiny cells | Expected counts below 5 invalidate the test |
| Treating "don't know" as a midpoint | Adds non-opinion to the neutral category |
| Reporting only the mean for a polarised distribution | Hides the actual finding |
| Using ANOVA on a single Likert item across 4 groups | Kruskal-Wallis is the correct test |
For the general test-selection logic behind these, see how to choose the right statistical test and ANOVA vs t-test. The debate on analysing Likert data in the medical education literature is a good short summary of where the methodological consensus actually sits. If you need scale validation, factor analysis or reporting done properly, our statistical and research data analysis service handles it.
The takeaway
Decide whether you are analysing items or scales, check reliability before combining, and match your statistics to the data type. Do that, and your Likert analysis will be both correct and defensible.
Frequently Asked Questions
Can you calculate a mean for Likert scale data?
For a single item, the mean is not strictly appropriate because the intervals between response options are not guaranteed to be equal — report the median and distribution instead. For a validated multi-item scale, taking the mean of the combined score is standard practice and widely accepted.
Is Likert data ordinal or interval?
A single Likert item is ordinal. A multi-item Likert scale, once its internal consistency is established, is conventionally treated as approximately interval for analysis purposes. This distinction resolves most disagreements on the topic.
What statistical test should I use for Likert data?
For a single item across two groups, Mann-Whitney U; across three or more, Kruskal-Wallis; for before-and-after on the same respondents, Wilcoxon signed-rank. For a reliable multi-item scale, use t-tests, ANOVA or regression on the composite score.
What is a good Cronbach's alpha?
0.70 or above is the standard threshold for research use, 0.80 or above is good. Below 0.50 the items should not be combined at all. Above 0.95 may indicate your items are near-duplicates rather than a well-rounded measure.
Should I use a 5-point or 7-point Likert scale?
5-point for field surveys, translated questionnaires and long instruments, where simplicity matters. 7-point when you need finer discrimination and respondents are literate and unhurried. The reliability gain from 7 points is real but modest.
How do I present Likert results in a report?
A diverging stacked bar chart, split at the neutral point, is the most informative format. Add a top-two-box percentage for the executive summary and a full frequency table in the appendix. Avoid presenting means alone, which hide polarised distributions.
Need help turning your data into defensible results? DSTechnoverse offers statistical and research data analysis services in SPSS, R, and Python — survey analysis, thesis and dissertation support, and business statistics. Get in touch to discuss your dataset.