
Two big families of statistics do very different jobs. Confusing them is one of the most common mistakes in student research. Here is the difference in plain language.
Descriptive statistics: describing what you have
Descriptive statistics summarise the data in front of you. They answer: what does this dataset look like?
They include:
- Measures of central tendency — mean, median, mode
- Measures of spread — range, variance, standard deviation
- Frequencies and percentages — how often each category appears
- Visual summaries — histograms, bar charts, box plots
Example: "The average age of our 200 respondents was 34, and 60% were women." That is description — no claims beyond the sample.
Inferential statistics: reaching beyond your sample
Inferential statistics let you draw conclusions about a larger population from your sample. They answer: what can I say about everyone, based on these few?
They include:
- Hypothesis tests — t-tests, ANOVA, chi-square
- Confidence intervals — a plausible range for the true value
- Regression — modelling and predicting relationships
- p-values — the probability your result is due to chance
Example: "Based on our sample, women are significantly more likely than men to prefer product A (p < 0.05)." That is inference — a claim about the whole population.
Why the distinction matters
- Descriptive stats are always valid for your sample — they just describe it.
- Inferential stats require good sampling and met assumptions. If your sample is biased, your inferences are wrong no matter how neat the maths.
How they work together
Almost every study uses both. You describe your sample first (who took part, what the data looks like), then use inference to test your hypotheses and generalise.
The one-line summary
Descriptive statistics tell you about your data. Inferential statistics let you make careful claims about the world your data came from.
Get the description right, respect the assumptions behind the inference, and your conclusions will hold up.
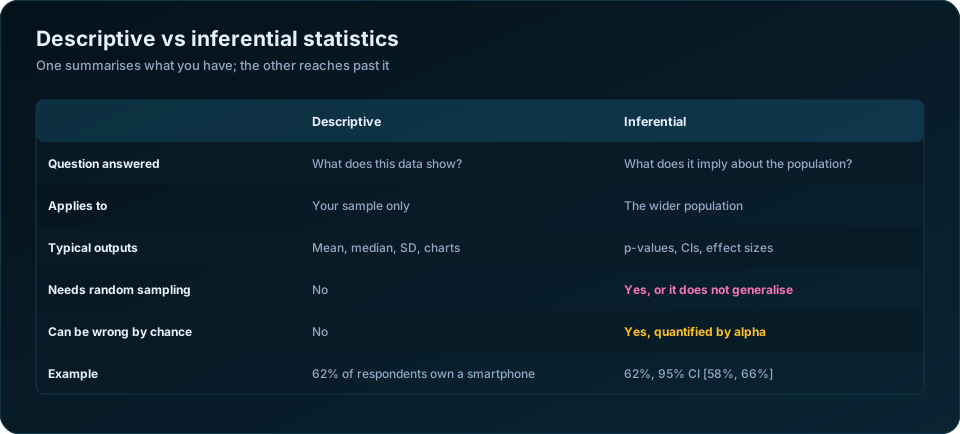
Side by side
| Descriptive | Inferential | |
|---|---|---|
| The question | What does this data show? | What does it suggest about the population? |
| Scope of the claim | Your sample, and only your sample | The population the sample came from |
| Typical outputs | Mean, median, SD, percentages, charts | p-values, confidence intervals, effect sizes |
| Requires random sampling | No | Yes, or the inference does not hold |
| Can be wrong by chance | No — it is arithmetic | Yes, and the risk is quantified |
| Sample size affects it | Precision only | Everything: power, significance, precision |
| Example statement | 62% of our 400 respondents own a smartphone | 62% of the district owns one, 95% CI [57%, 67%] |
The clearest way to hold the distinction: descriptive statistics cannot be wrong, only misleading. If you calculate the mean of your 400 responses correctly, that is the mean, full stop. Inferential statistics can be wrong, because they make a claim about people you never spoke to — and the whole apparatus of p-values and confidence intervals exists to quantify how wrong they might be.
The descriptive toolkit, and choosing between mean and median
| Statistic | What it captures | Use when |
|---|---|---|
| Mean | Arithmetic average | Roughly symmetric data with no extreme values |
| Median | Middle value | Skewed data — income, land, expenditure, waiting times |
| Mode | Most frequent value | Categorical data |
| Standard deviation | Typical distance from the mean | Reported alongside the mean |
| Interquartile range | Spread of the middle half | Reported alongside the median |
| Range | Minimum to maximum | Quick screening; sensitive to outliers |
| Skewness | Asymmetry | Deciding between mean and median |
| Percentiles | Position in the distribution | Benchmarking and cut-offs |
For most household data in India — monthly income, land holding, health expenditure — the distribution is right-skewed, and the mean sits well above what a typical household experiences. A village where mean monthly income is 18,000 rupees but median income is 9,500 has a handful of prosperous households pulling the average up. Reporting only the mean would describe a village nobody lives in.
The rule that follows: report the median with the interquartile range for skewed variables, the mean with the standard deviation for symmetric ones, and both when the audience needs to see the gap.
When you are allowed to make an inference
Inferential statistics rest on an assumption that is easy to state and often quietly violated: your sample was drawn randomly from the population you want to describe.
| Sample | Inference valid for |
|---|---|
| Random sample of 400 households in a district | The district |
| Every household in one village | That village only — it is a census, use descriptives |
| Volunteers who responded to a poster | Nobody definable |
| Online panel of urban smartphone users | Urban smartphone users on that panel |
| Stratified random sample with weights applied | The population, with correct weighting |
| The 45 employees of one firm | That firm — again a census |
Two consequences that surprise people. First, if you surveyed the entire population — all 45 employees, all 12 treatment plants — you do not need inferential statistics at all. You know the answer. A p-value here is meaningless, because there is nothing to infer to.
Second, a convenience sample of 5,000 supports weaker inference than a random sample of 400. Sample size cannot repair a biased sampling frame; it only makes the biased estimate more precise. This is why sampling method determines whether inference is possible at all, and sample size only determines how precise it will be.
How they work together in a real report
A well-structured results chapter uses both in sequence, and the order is not arbitrary:
| Section | Statistics used | Purpose |
|---|---|---|
| Sample profile | Descriptive | Who did we actually reach? |
| Key indicators | Descriptive, with CIs | What did we find, and how precisely? |
| Group comparisons | Inferential | Do these differences hold beyond the sample? |
| Relationships | Inferential | Which factors are associated with the outcome? |
| Impact estimates | Inferential | Did the intervention change anything? |
Skipping the descriptive stage is a genuine error, not a stylistic choice. You cannot sensibly run a t-test on a variable whose distribution you have not looked at — the assumption checks that decide which test is appropriate are descriptive work. Every histogram and boxplot you draw before testing is doing real methodological work.
The reverse mistake is stopping at descriptives. "Village A reported 71% coverage and Village B reported 64%" invites the reader to conclude A is doing better, when with 90 households per village that gap could easily be noise. If you present a comparison, you owe the reader either a confidence interval or a test.
The line to watch in your own writing
The distinction usually breaks down in a single sentence. Descriptive findings should be written in the past tense about your respondents; inferential findings can generalise.
| Weak | Better |
|---|---|
| "Women are more likely to attend" | "Attendance was 12 points higher among women (95% CI [4, 20])" |
| "The programme improved incomes" | "Incomes in treatment villages rose 8% more than in control villages, p = 0.01" |
| "Most people in the district prefer X" | "68% of our sample preferred X, 95% CI [63%, 73%]" |
| "There was no difference between groups" | "We found no evidence of a difference (p = 0.34); the study was powered to detect 6 points or more" |
For the mechanics behind the inferential column, see the five steps of hypothesis testing and the p-value explained. Our Word in Data's guide to statistical literacy and the NIST/SEMATECH handbook are both good free references. If you want the descriptive and inferential sections of a report built properly, our statistical and research data analysis service covers both.
Frequently Asked Questions
What is the main difference between descriptive and inferential statistics?
Descriptive statistics summarise the data you actually collected. Inferential statistics use that sample to draw conclusions about the wider population, with a quantified level of uncertainty. Descriptive statements are certain about the sample; inferential statements are probabilistic about the population.
Is a percentage descriptive or inferential?
A raw percentage of your sample is descriptive. The same percentage reported with a confidence interval, as an estimate for the population, is inferential. The number is identical; the claim being made is not.
Do I need inferential statistics if I surveyed everyone?
No. If you collected data from the entire population — every employee, every plant, every village in a defined list — you have a census. Descriptive statistics give you the exact answer, and p-values have nothing to infer to.
Can I use inferential statistics on a convenience sample?
Strictly, no — the mathematics assumes random sampling. In practice many studies do it anyway, but the honest approach is to state the limitation clearly and avoid generalising to a population your sampling frame never covered.
Should I report the mean or the median?
Median for skewed data such as income, land holding or expenditure, where extreme values distort the mean. Mean for roughly symmetric data. When the two differ substantially, report both — the gap is itself a finding about inequality in the distribution.
Which comes first in a research report?
Descriptive statistics always come first: the sample profile and the distribution of key variables. They set the context and drive the assumption checks that determine which inferential tests are appropriate.
Need help turning your data into defensible results? DSTechnoverse offers statistical and research data analysis services in SPSS, R, and Python — survey analysis, thesis and dissertation support, and business statistics. Get in touch to discuss your dataset.