Search for "AERMOD online" and you will find three very different things under the same name: desktop programs that download weather data from the internet, genuine web applications that run the US EPA model on a server, and simple plume calculators that are not AERMOD at all. For an engineer who needs a defensible result for an Environmental Clearance (EC) or Consent to Establish (CTE) application, the difference matters a great deal.
This guide explains what an online AERMOD run actually involves, walks through one from site coordinates to a finished report, lists the checks that separate a trustworthy web tool from a risky one, and is honest about where browser-based modelling stops being enough. The worked example uses our own software, AERMOD Studio, with a dummy plant near Indore — every number and figure below comes from a real run of the EPA programs, not a mock-up.
Why People Search for "AERMOD Online"
AERMOD is the US Environmental Protection Agency's preferred model for near-field dispersion from industrial sources, and it is the model most Indian EIA reports use for predicting ground-level concentrations (GLCs). The model itself is free. What is not free is the effort around it: AERMOD is a command-line Fortran program that reads a text control file, and it needs a meteorological file that another program, AERMET, has to build from raw weather observations. Doing that by hand takes skill and time, and most people who need a study once or twice a year do not want to learn it.
So the search for "AERMOD online" usually means one of these:
- "I do not want to install and maintain modelling software." Desktop packages need a Windows machine, a licence, updates and someone who remembers how to use them.
- "I do not want to deal with meteorological data." Finding a representative station, downloading its records, checking completeness and running AERMET is the hardest part of any study.
- "I need a quick answer." A stack height decision, a screening check before a site is bought, a what-if on a control device.
- "I need a report in the format my regulator expects." For India, that means GLCs, isopleths, a comparison with the National Ambient Air Quality Standards (NAAQS) 2009 and the cumulative impact with baseline air quality.
A good online tool answers all four. A bad one answers the third and quietly fails the other three.
What "AERMOD Online" Can Mean
Before comparing tools, it helps to be precise about what is actually running.
1. Desktop software with online data
Commercial interfaces such as Lakes Environmental's AERMOD View and Trinity Consultants' BREEZE AERMOD are Windows programs. They wrap the EPA executables in a graphical interface, and many can download terrain or weather data from the internet. The model runs on your computer. This is "online" only in the sense that some inputs are fetched over the network.
2. Web applications that run the EPA programs on a server
Here the interface is a web page and the EPA programs run on a machine operated by the provider. You enter the study in a browser, the server runs AERMET and AERMOD, and the results come back to the page. Nothing is installed on your side. AERMOD Studio works this way: the browser holds the study, and our processing machine runs the unmodified EPA executables.
3. Plume calculators
Some websites calculate a Gaussian plume from one stack and one wind speed. They can be useful for teaching, but they are not AERMOD: they do not use hourly meteorology, boundary-layer similarity theory, the regulatory options or a receptor grid. A result from such a calculator should never appear in an EIA as an "AERMOD" result.
| Type | Where the model runs | Meteorology | Suitable for regulatory studies |
|---|---|---|---|
| Desktop interface with online data | Your computer | You prepare it, often with built-in downloaders | Yes, with a trained user |
| Web application running EPA programs | Provider's server | Prepared by the tool, ideally documented | Yes, if the checks below are met |
| Plume calculator | Your browser | One assumed condition | No |
How AERMOD Works, in One Page
A short refresher helps make sense of what any online tool has to do behind the scenes. (For the full explanation see our knowledge-base article on how AERMOD works.)
AERMOD is a steady-state plume model. For every hour of the study period it takes the wind speed and direction, the mixing height, the atmospheric stability and the temperature profile, works out how far the plume rises and how it spreads, and calculates the concentration at every receptor. It then averages those hourly values into the periods the standards use — 1 hour, 8 hours, 24 hours, or the whole period — and reports the highest values.
Four EPA programs make up the modelling system:
- AERMET turns surface weather observations and upper-air soundings into the two files AERMOD reads: a surface file with boundary-layer parameters for every hour, and a profile file with wind and temperature with height.
- AERMAP assigns terrain elevations to sources and receptors, for sites where the ground is not flat.
- BPIP-PRIME calculates building dimensions for stacks close to buildings, so AERMOD can account for downwash.
- AERMOD does the dispersion calculation itself.
An online tool that calls itself AERMOD must, at minimum, run AERMET and AERMOD. Whether it also handles terrain and buildings is one of the most important questions to ask (more on that below).
An Online AERMOD Run, Step by Step
The best way to understand a browser-based run is to follow one. The example below is a dummy test study — a single 35 m boiler stack at a fictional facility in Indore, Madhya Pradesh, modelled for March to May 2025 — run in AERMOD Studio.
Step 1: The study and the site
The first form asks for the client, the purpose of the study and a report number, then the site: coordinates, ground elevation, the dominant land use within 3 km and whether the area is rural or urban for dispersion purposes.
That last choice deserves care. AERMOD uses urban dispersion coefficients only where urban land-use types — industrial, commercial and dense residential — make up more than half of the area within 3 km of the source, following the land-use method in the US EPA Guideline on Air Quality Models. An industrial estate inside farmland is usually still rural. AERMOD Studio asks for the urban share as a percentage, warns you if the rural or urban choice does not match it, and writes the justification into the report so a reviewer can see why the choice was made.
The land use also sets the surface characteristics AERMET needs — the albedo, the Bowen ratio and the surface roughness length — which influence how turbulent the lower atmosphere is.
Step 2: The stacks
For each stack you enter the location, height, inner diameter, exit temperature and exit velocity, and the emission rate of each pollutant in grams per second. Indian monitoring reports often give concentrations in mg/Nm³ and flows in Nm³/h rather than emission rates, so a converter in the form turns those into g/s. Studies with many stacks can be pasted from a spreadsheet.
Typical pollutants for an Indian EIA are PM10, PM2.5, SO₂, NOx and CO. NOx is usually assessed as NO₂ assuming complete conversion, which is conservative and is how AERMOD Studio reports it.
Step 3: Receptors and the plant boundary
AERMOD calculates concentrations at receptors. A complete study needs three kinds:
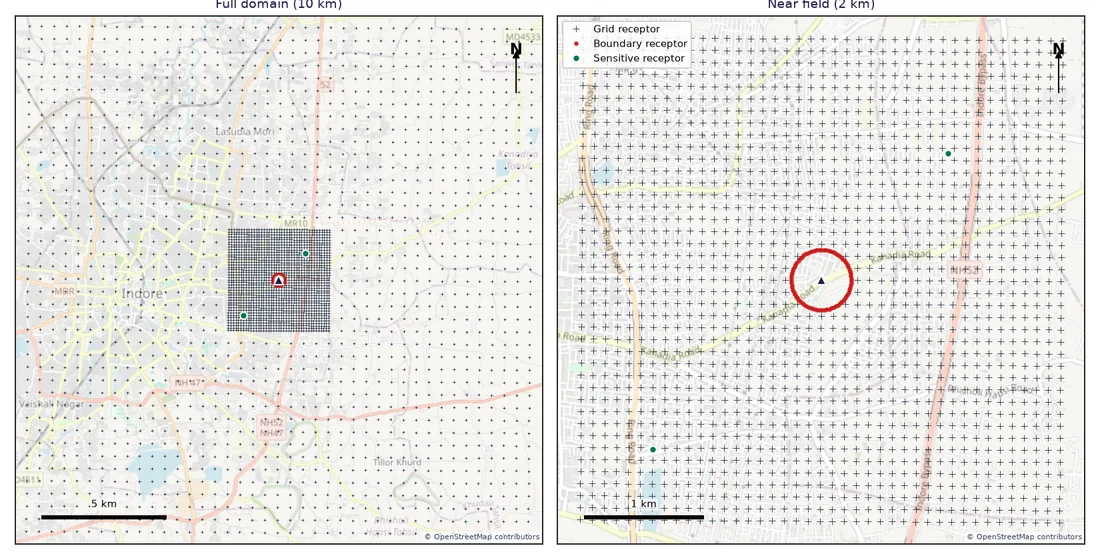
- A receptor grid that covers the study area. AERMOD Studio uses a nested Cartesian grid: 100 m spacing within 2 km of the site, where the maximum usually is, and 500 m spacing out to 10 km.
- Boundary receptors along the plant's fence line. Ambient air quality standards apply where the public can be, so the reported maximum should be outside the plant. If you give the boundary as a radius or as corner coordinates, grid receptors inside it are left out and receptors are placed every 25–50 m along it.
- Discrete receptors at sensitive locations — villages, schools, hospitals — where concentrations are reported individually.
The receptor grid map that the software draws for the report shows all three:
For more on why grid design changes the answer, see our guide to receptor grid design.
Step 4: Baseline air quality
The NAAQS apply to the total concentration people breathe, not to the project's increment alone. So the study needs the measured background: for each monitoring station, the 24-hour values (usually the 98th percentile of the season's samples), CO as 1-hour and 8-hour values, and the mean over the monitoring period. The software records the monitoring period, the number of samples and the statistic used, and adds the highest station value to the maximum predicted increment — a conservative approach, because the highest background and the highest increment rarely coincide in place and time.
Step 5: Meteorology
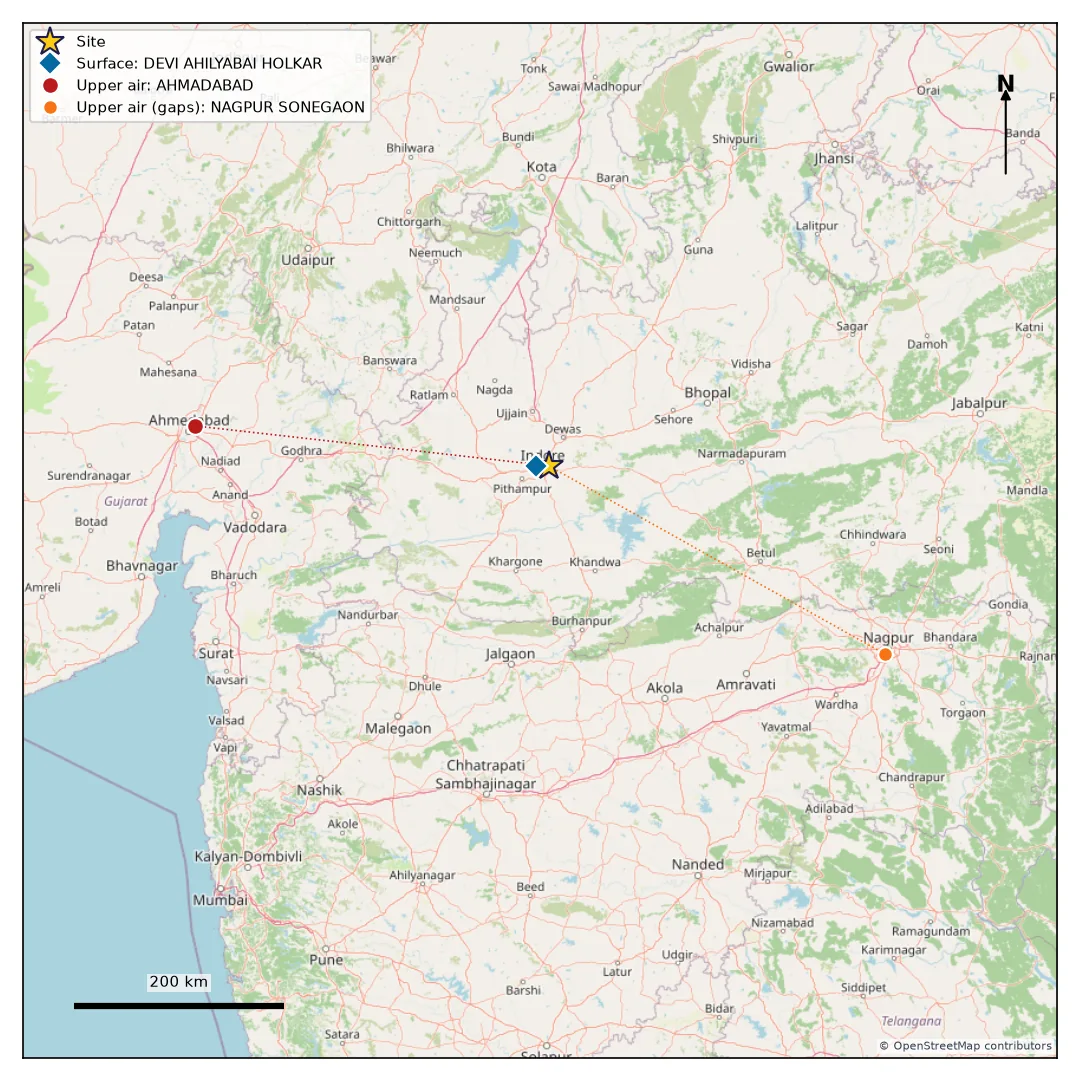
This is where an online tool earns its keep. In the example, the software checked every NOAA airport station within 150 km. The nearest, Indore airport, had only 80% valid hours for the period, below the 90% that regulatory practice expects, and the others had far less. With no airport passing, the software switched to NASA POWER hourly data for the exact site coordinates, filled the few gaps from Indore airport, and used upper-air soundings from Ahmedabad because the closer stations had too few morning soundings in the period. Every one of those decisions was recorded, with distances and percentages, in the report.
The meteorological stations map makes the choice visible at a glance:
Meteorological data is a topic in its own right, and it changed in 2025 when NOAA's legacy station files stopped updating. We cover the options in detail in NOAA ISD stopped in 2025: meteorological data for AERMOD now, and the processing itself in AERMET explained.
Step 6: The run
Pressing "Run AERMOD" queues the study. The processing machine downloads the meteorological data (cached for later runs in the same area), runs AERMET, writes an AERMOD control file for each pollutant, runs AERMOD, and post-processes the plot files into tables and maps. The page shows each step as it happens — meteorology, AERMOD for each pollutant, post-processing, upload — and for a three-month study the whole run typically takes three to six minutes.
Two automatic checks run before any result is reported:
- Data capture. AERMOD counts the hours with missing meteorology. If fewer than 90% of hours are valid, the run stops with "insufficient meteorology" and produces no NAAQS verdict, unless you deliberately choose a watermarked draft.
- Internal consistency. A period average can never exceed the maximum 24-hour value of the same pollutant; if it does, the meteorology is incomplete in a way that distorts the averages, and the run is flagged.
Step 7: Results
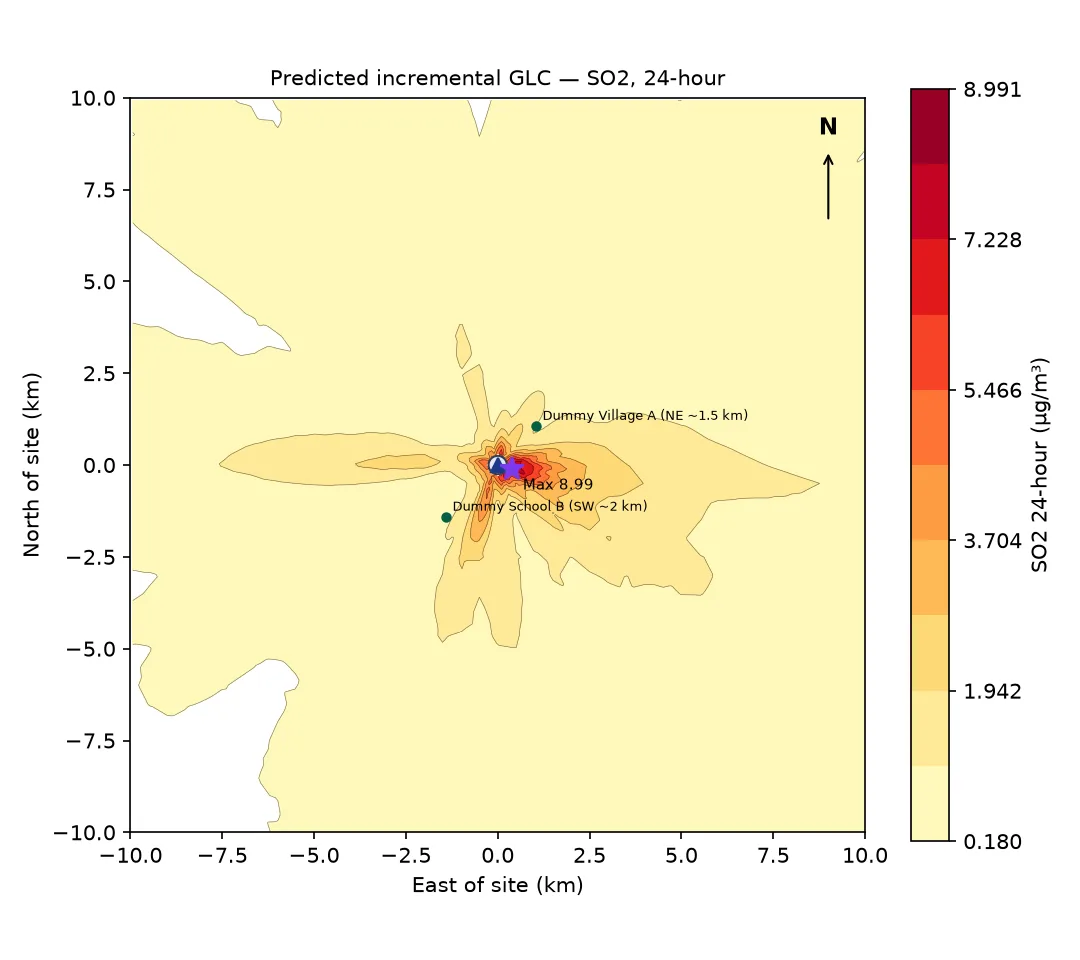
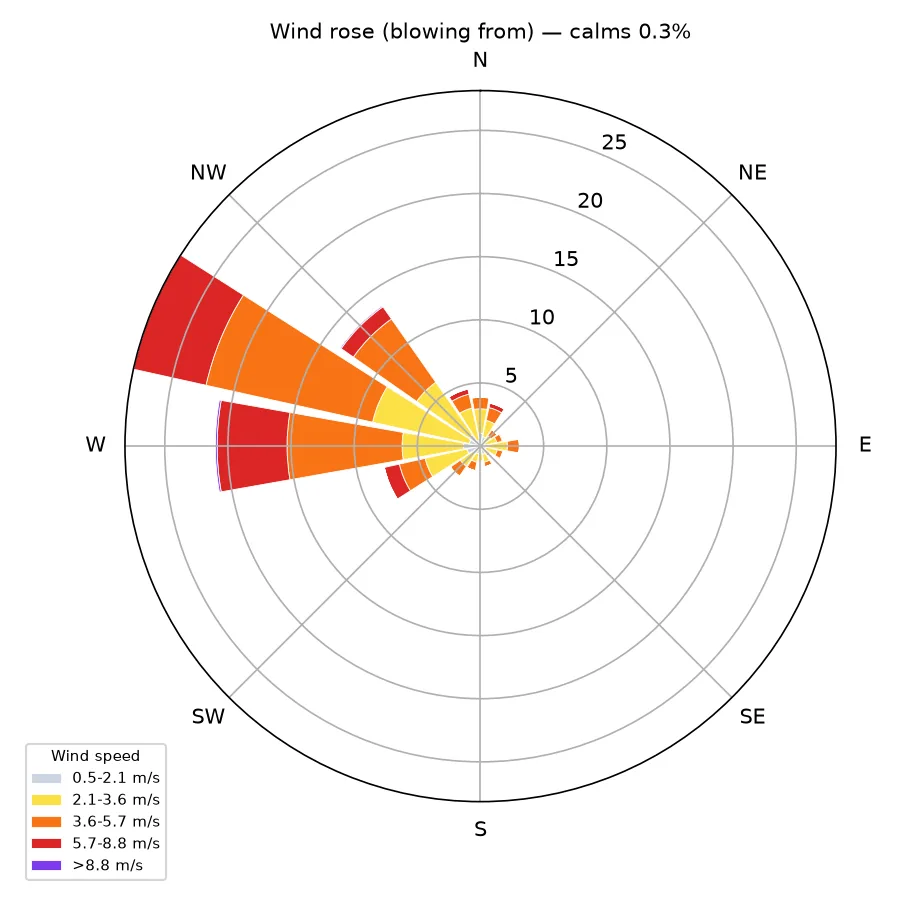
The results tab shows the maximum incremental GLC for every pollutant and averaging period, with its distance and direction from the site and whether it falls on or outside the plant boundary; the values at each sensitive receptor; the isopleth map for each averaging period; and the wind rose.
In the example, the highest 24-hour SO₂ increment was 8.99 µg/m³, about 0.4 km east-south-east of the stack and outside the 250 m plant boundary, against a 24-hour NAAQS of 80 µg/m³.
Step 8: The NAAQS comparison and the report
The comparison table adds the background to each maximum increment and compares the total with the standard. It also shows the project's share of every total, and it treats one situation that many reports get wrong: when the background alone already exceeds a standard. In that case the status reads "background exceeds standard; project contribution X (Y%)", and the conclusions do not recommend controls on that basis alone, because the exceedance is not caused by the project.
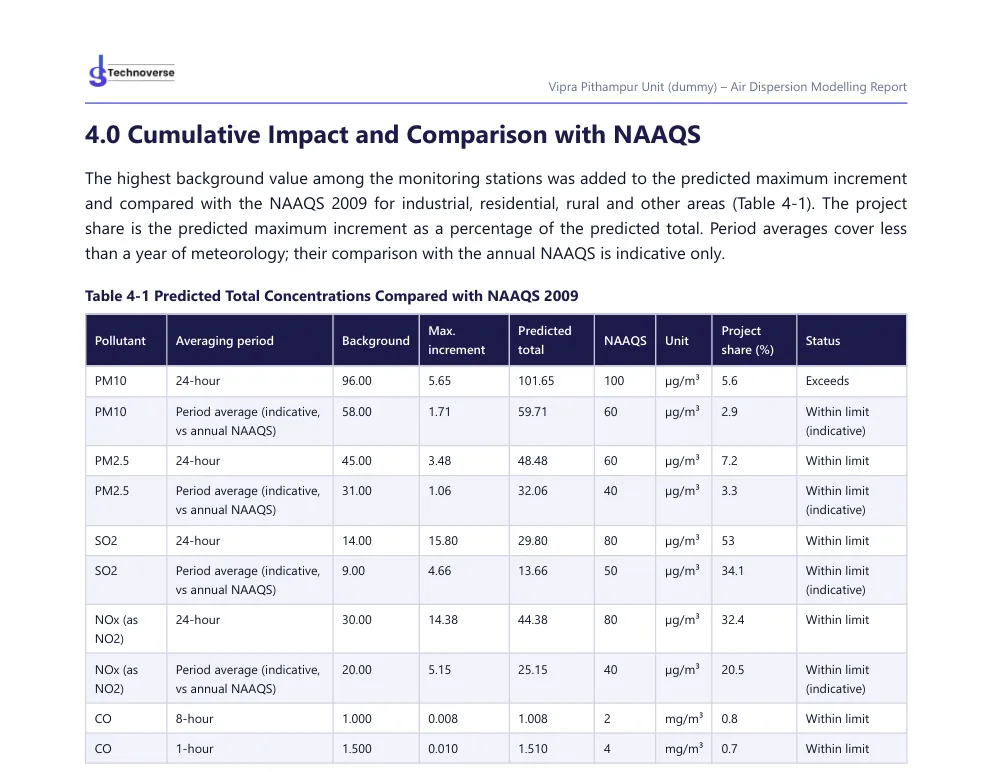
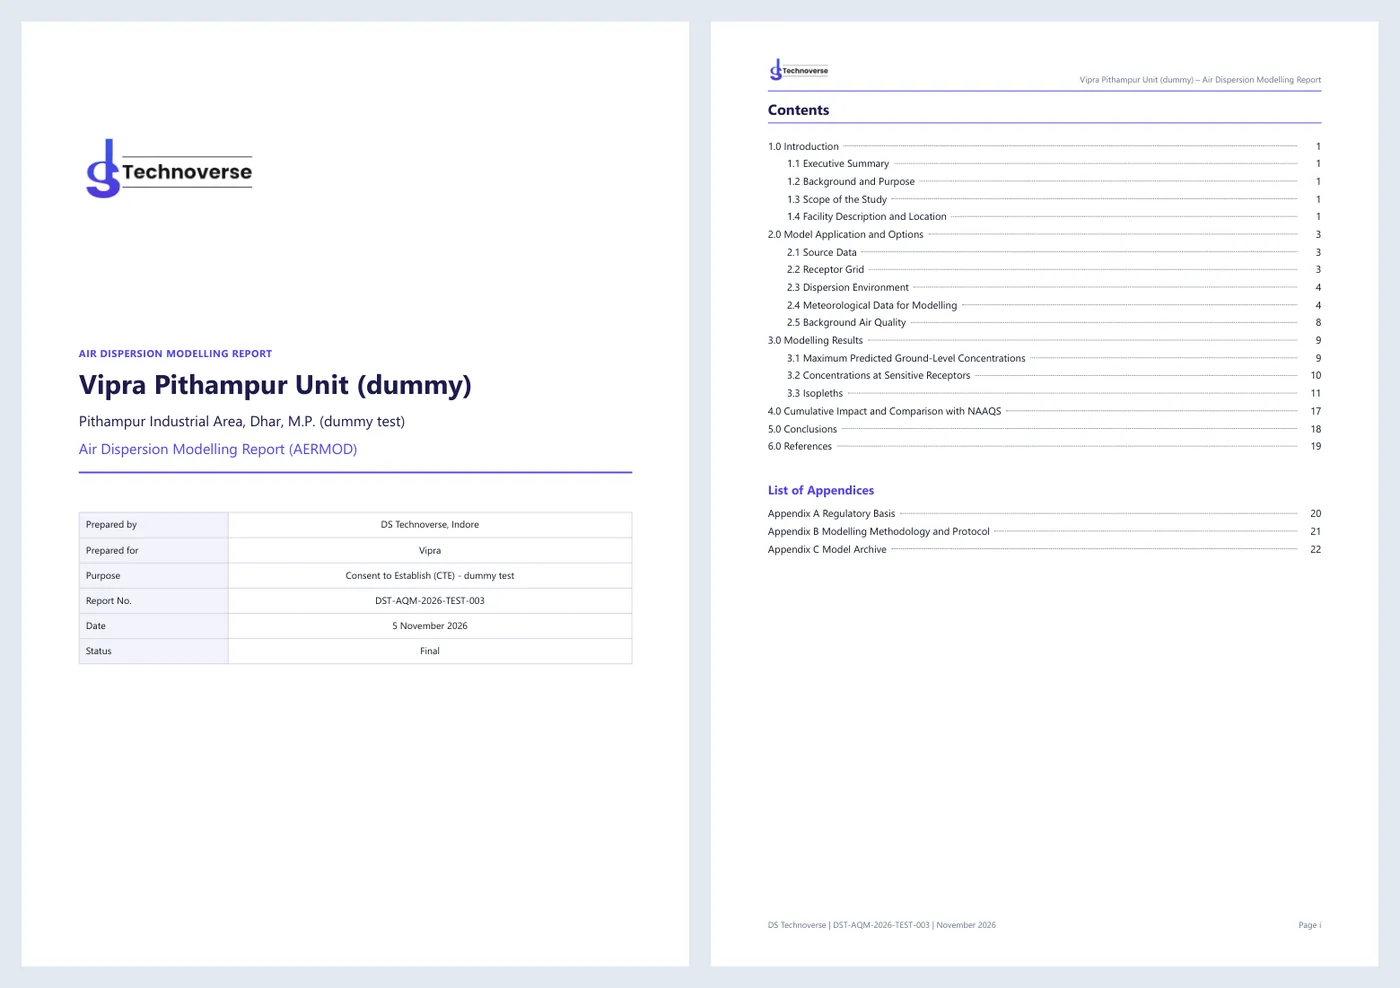
Finally, the report: a cover and sign-off page, contents and lists of tables and figures with page numbers, a header and footer on every page, the site location map with its 3 km circle, the stack, receptor, meteorological and background tables, the isopleths, the conclusions with the data capture and the limitations stated, and appendices on the regulatory basis, the modelling protocol and the model archive. It downloads as a PDF, and the AERMET and AERMOD input and output files come with it.
Eight Checks Before You Trust Any Online AERMOD Tool
Whichever tool you use, these questions decide whether its output will survive review by a State Pollution Control Board or an Expert Appraisal Committee.
1. Is it the real EPA model, and which version?
The report should name AERMOD and AERMET and print their version numbers. "Based on AERMOD" or "AERMOD-like" is a warning sign. The regulatory default options should be stated (in AERMOD's control file this is the DFAULT keyword).
2. Can you get the input and output files?
A reviewer, an auditor or a second modeller must be able to reproduce the run. Ask for the AERMET control and report files, the processed surface and profile files, and the AERMOD input and output for each pollutant. If a tool will not give you its files, you cannot defend its numbers.
3. Where does the meteorology come from, and how complete is it?
The report should name the surface and upper-air stations, their distances and identifiers, the period, and the percentage of valid hours. EPA guidance on meteorological monitoring for regulatory modelling expects at least 90% data completeness; a tool that does not report it is hiding the most common reason for rejection.
4. Why were the stations chosen?
"The nearest station" is not a justification if the nearest station had half its hours missing. The best tools show every station considered and the reason it was used or rejected.
5. Is the receptor grid fine enough where it matters?
The maximum from an elevated stack typically falls within a few hundred metres to a few kilometres. A coarse grid can miss it. Look for fine spacing near the source and receptors along the fence line.
6. Is the plant boundary handled?
Results inside the plant are not ambient air. If the tool cannot exclude them, the reported maximum may be a number that no member of the public will ever breathe — or, worse, the true off-site maximum may be hidden in a table of on-site values.
7. Is the background added correctly?
The cumulative assessment should state which background statistic was used, from which stations and periods, and how it was combined. Comparing a seasonal period average with an annual standard should be labelled as indicative.
8. What does the tool not do?
Every tool has limits. A trustworthy one says so plainly. If yours does not model terrain, building downwash or fugitive sources, the report must not imply that it did.
Online or Desktop: How They Compare
| Consideration | Desktop AERMOD interface | Online AERMOD application |
|---|---|---|
| Installation and updates | You install and update the software and the EPA executables | None on your side |
| Licence model | Usually per seat, perpetual or annual | Usually per study or per account |
| Meteorological processing | You run AERMET, often with helper tools | Done by the tool; quality depends on its rules |
| Flexibility | Very high: every AERMOD option is available | Limited to what the application exposes |
| Skills needed | A trained modeller | Basic understanding of the inputs |
| Speed for a standard study | Hours to days, depending on the user | Minutes to run, plus input preparation |
| Complex sites (terrain, buildings, many source types) | Fully supported | Depends on the application |
| Report | Usually assembled by the user | Can be generated in a fixed format |
The honest conclusion is that the two are complementary. A modelling desk that runs dozens of complex studies a year needs a full desktop package and trained staff. A consultant, an industry or a laboratory that needs standard stack studies quickly, in a format the regulator recognises, is usually better served by a good online application — with a specialist on call for the studies that fall outside it.
The Indian Regulatory Context
An online tool built for the US market will not necessarily produce what an Indian application needs. Three things are specific to India.
The standards. Results are compared with the NAAQS notified by the Central Pollution Control Board (CPCB) on 18 November 2009: for example 100 µg/m³ for 24-hour PM10, 60 µg/m³ for PM2.5, 80 µg/m³ for SO₂ and NO₂, and 2 mg/m³ (8-hour) and 4 mg/m³ (1-hour) for CO. The US standards are expressed differently, so a US-oriented tool's compliance statements do not transfer.
The EIA process. Under the EIA Notification, 2006, the impact prediction is part of an EIA report that also includes baseline monitoring of ambient air quality — typically one season other than the monsoon — and meteorology from a station at the site during that season. The model results are added to the measured baseline. CPCB's guidelines on air quality modelling describe the expected approach.
The report. Reviewers expect a familiar structure: project and source description, meteorology, model setup, maximum GLCs with their locations, isopleths, cumulative impact against the NAAQS, and conclusions. Our article on what an air dispersion modelling report should contain goes through it in detail.
AERMOD Studio was built around these requirements rather than adapted to them: the NAAQS 2009 table, the cumulative assessment and the report structure are part of the software.
Where Online Modelling Stops Being Enough
A browser-based tool is a fast, consistent way to run standard studies. It is not a substitute for a modeller on every project. Bring in specialist help when:
- The terrain is complex. Sites in hills or valleys need terrain elevations for sources and receptors (AERMAP), because plumes can impact elevated ground at much higher concentrations than flat-terrain modelling suggests. Our article on terrain and land use in AERMOD explains why.
- Stacks are close to tall buildings. Building wakes can bring a plume to the ground near the source. That needs BPIP-PRIME building downwash.
- Sources are not stacks. Fugitive dust from mines, stockpiles and haul roads, or emissions from open areas and roads, need area, volume or line sources.
- The study is contested. Public hearings, court cases and expert reviews call for sensitivity runs, alternative meteorology and a modeller who can defend every assumption in person.
- The pollutant is unusual. Odour, deposition, secondary particulate formation and long-range transport need different approaches — sometimes a different model altogether (see AERMOD vs CALPUFF).
AERMOD Studio's current scope is point sources over flat terrain with the regulatory default options. Studies outside that scope go to our modelling team as a modelling service, with the same report standard.
Reproducing an Online Result on Your Own Computer
The best test of any online tool is whether its result can be reproduced without it. With a proper model archive this takes minutes:
- Download the EPA AERMOD executable of the same version as the one printed in the report.
- Unzip the model archive. For each pollutant there is a folder with the AERMOD control file (aermod.inp) and the output listing; the processed meteorological files (aermet.sfc and aermet.pfl) sit in the meteorology folder.
- Check that the control file points to the meteorological files; adjust the paths if you moved them.
- Run AERMOD with the control file and compare the new output with the archived one. The maximum values, their receptor locations and the count of missing hours should match exactly.
- To go one step further, re-run AERMET with its control file and the raw data, and compare the processed files.
If the numbers match, the online tool did exactly what the EPA program does. If a tool cannot give you the files to do this, its results are, in practice, unverifiable.
Data Privacy and Confidentiality
Emission data and plant layouts are commercially sensitive. Before entering them into any online tool, ask:
- Who can see the studies? A tool used by several companies must keep each company's studies separate.
- Where is the data stored, and for how long? Can you delete a study and its results?
- Are the model files and reports available only to your account?
- Does the provider use your data for anything other than your study?
At DS Technoverse, studies and results are available only to signed-in users of the account, files are stored with the run that produced them, and we do not use client data for anything other than the client's own study.
Practical Tips for Your First Online Study
- Collect the stack data first. Most delays come from missing exit velocities and temperatures. Our AERMOD input data checklist lists everything you need.
- Check the emission units twice. A mix-up between g/s and kg/h changes the answer by a factor of 3.6.
- Use the baseline season as the study period. It makes the cumulative assessment consistent with the measured background.
- Prefer site meteorology when you have it. If your baseline monitoring included a weather station, upload its hourly data instead of relying on a distant airport or a reanalysis.
- Draw the boundary. It changes the reported maximum more often than people expect.
- Read the meteorology section before the results. If the data capture is low or the stations are far away, fix that before you look at the numbers.
- Run a what-if. Change the stack height or the emission rate and run again; the comparison is often more useful than the first result.
How AERMOD Studio Fits In
AERMOD Studio is our answer to the problems above: the EPA programs, run on our side; meteorology selected by documented rules, with every rejected station and its reason in the report; plant boundaries, background and the NAAQS 2009 comparison built in; and a report in the structure Indian reviewers expect, with the model files alongside. It is designed for consultants, industries and laboratories that need standard stack studies done consistently and quickly — and it is backed by the same team that runs complex studies as a service.
The demo is free and uses your own site. You send the coordinates, the stacks and the season; we run it and take you through the meteorology, the isopleths and the report online. The demo report is watermarked "DRAFT" so it is never mistaken for a submission copy.
Frequently Asked Questions
Can I run AERMOD online for free?
The US EPA AERMOD and AERMET programs are free to download and run on your own computer, but they are command-line programs that need prepared meteorological files. Online applications that run them for you are usually paid services; many, including AERMOD Studio, offer a free demo. Our article Is AERMOD free? explains what is free and what is not.
Is an online AERMOD result acceptable to Indian regulators?
What reviewers assess is the model, the inputs and the documentation, not whether the interface was a desktop program or a web page. If the tool runs the real EPA programs with the regulatory options, uses representative and sufficiently complete meteorology, and provides the input and output files, the result can be defended in the same way as one from a desktop package.
How long does an online AERMOD run take?
For a single-season study of a few stacks with a standard receptor grid, the model run itself takes a few minutes. The time that matters is collecting the inputs: stack parameters, emission rates, the boundary and the baseline data.
Do I need meteorological data of my own?
No — a good online tool selects and processes public data automatically. But if your EIA baseline included a site weather station, its hourly data is usually the most representative choice and should be used.
Can an online tool model terrain and buildings?
Some can, many cannot. AERMOD Studio currently models flat terrain without building downwash; such studies are handled by our modelling team.
What pollutants can be modelled?
Any pollutant that is emitted and does not react significantly over the study distance can be modelled with AERMOD. AERMOD Studio covers PM10, PM2.5, SO₂, NOx (as NO₂) and CO, which are the pollutants of most Indian EIA and consent studies.
Can I change an input and run the study again?
Yes. Every run is kept with the inputs that produced it, so you can compare a 30 m stack with a 45 m stack, or a study with and without a control device, side by side.
What do I get at the end?
A results page with tables, isopleths and the wind rose, a PDF report in the structure used in Indian EIA practice, and an archive of the AERMET and AERMOD files for the run.
See AERMOD Studio run your own site — the demo is free. Send us the site coordinates, the stacks and the season you want to model; we run the study and take you through the meteorology, the isopleths and the report in a short online session. See AERMOD Software (AERMOD Studio), or if your study needs terrain, building downwash or area sources, our AERMOD modelling service. DS Technoverse is based in Indore, Madhya Pradesh and works with consultants and industries across India.