
No number in statistics is quoted more often — or misunderstood more badly — than the p-value. If you can explain it correctly, you are ahead of most researchers. Here it is, in plain language.
What a p-value actually is
A p-value answers a very specific question:
If there were truly no effect, how likely would I be to see a result at least as extreme as the one I got?
A small p-value means your result would be unlikely if nothing were going on — which is evidence that something is going on.
- p = 0.03 means: if there were no real effect, you would see a result this extreme only 3% of the time.
- The common threshold p < 0.05 is a convention, not a law of nature.
What a p-value is NOT
This is where most people go wrong. A p-value is not:
- The probability that your hypothesis is true
- The probability the result happened "by chance"
- A measure of how big or important the effect is
- Proof of anything
A tiny p-value with a trivial effect size can be practically meaningless.
Significant vs important
"Statistically significant" only means the result is unlikely under the no-effect assumption. It says nothing about whether the effect matters. With a big enough sample, even a microscopic difference becomes "significant." That is why you must always report effect size alongside the p-value.
How to interpret p-values honestly
- Report the exact value (p = 0.03), not just "p < 0.05."
- Pair it with an effect size so readers see magnitude, not just significance.
- Do not treat 0.05 as magic — 0.049 and 0.051 are essentially the same evidence.
- Do not run dozens of tests and report only the significant ones.
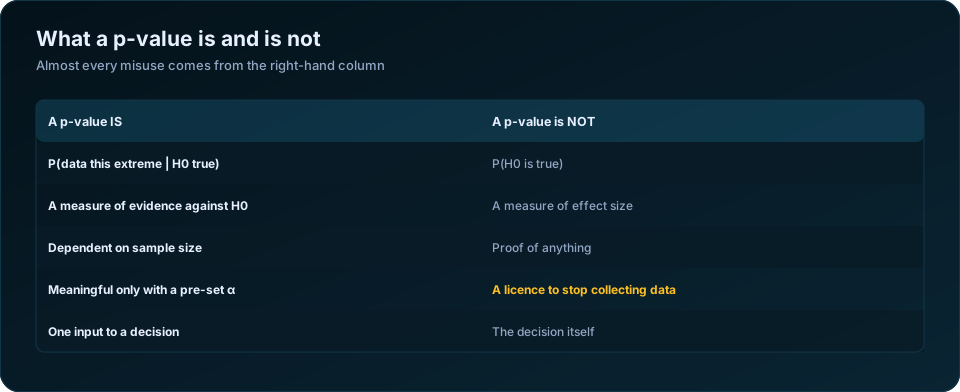
The six misreadings, one at a time
Almost every misuse of a p-value is one of six specific mistakes. Naming them makes them easier to catch in your own writing.
"p = 0.03 means there is a 3% chance the null is true." This is the most common error and it inverts the conditional probability. The p-value is the probability of data this extreme given the null is true. It says nothing about the probability of the null itself, which would require knowing how plausible the hypothesis was before you started.
"p = 0.06 means there is no effect." It means the evidence did not clear an arbitrary line. A study with 40 participants and p = 0.06 may be pointing at something real that it was simply too small to confirm. Compare p = 0.049 and p = 0.051 honestly: those are the same result.
"p < 0.001 means a large effect." It means the result would be very unlikely under the null. With 50,000 records, a difference of 0.3% in conversion produces p < 0.001 and is commercially meaningless. Sample size drives p as much as the effect does.
"The result is significant, so it matters." Statistical significance and practical significance are different questions. Always report the effect size next to the p-value so a reader can judge both.
"We can stop collecting data now that p < 0.05." Checking the data repeatedly and stopping when the threshold is crossed inflates the false-positive rate dramatically — to well over 20% in common scenarios. Fix your sample size in advance, or use a formal sequential design that accounts for the peeking.
"p = 0.20 in a small study means we can conclude equivalence." Failing to find a difference is not the same as demonstrating there is none. If equivalence is the actual question, use an equivalence test with a pre-declared margin.
Confidence intervals say more than p-values
The single best habit to adopt is reporting a confidence interval alongside — or instead of — a p-value. The interval carries everything the p-value carries, plus the magnitude and the precision.
| What you report | What a reader learns |
|---|---|
| p = 0.03 | The result cleared the 0.05 line. Nothing else. |
| Difference = 4.1 points, p = 0.03 | Direction and size, but not how precisely estimated |
| Difference = 4.1 points, 95% CI [0.4, 7.8] | The effect is probably positive, but could be trivial or substantial |
| Difference = 4.1 points, 95% CI [3.6, 4.6] | A precisely estimated effect of about 4 points |
The third and fourth rows both produce p = 0.03 in some settings, yet they support very different decisions. That difference is invisible if you report only the p-value.
A useful shortcut: if the 95% confidence interval for a difference excludes zero, p is below 0.05. The interval gives you the test for free and tells you the effect size as well.
Reading a p-value correctly: three scenarios
| Scenario | Result | The honest reading |
|---|---|---|
| Pilot study, n = 30 per group | d = 0.55, p = 0.09 | A promising medium effect, underpowered. Worth a larger study, not a claim. |
| Large panel, n = 22,000 | 0.4% difference, p < 0.001 | Almost certainly a real but trivially small difference. Probably not actionable. |
| Field trial, n = 400 per arm | 8-point gain, 95% CI [3, 13], p = 0.002 | Solid evidence of a meaningful effect. Report and act. |
Note that the middle row is where large organisations most often go wrong. Big data makes p-values small by default; treating significance as the decision rule in that setting guarantees a stream of statistically significant irrelevancies.
How to write about p-values in a report
| Do | Do not |
|---|---|
| Report the exact value: p = 0.032 | Report only "p < 0.05" |
| Write p < 0.001 for very small values | Write p = 0.000 — SPSS rounding, not a real value |
| Pair every p with an effect size and CI | Present a table of bare p-values |
| Say "we did not find evidence of a difference" | Say "there was no difference" |
| Declare how many tests you ran | Report only the ones that worked |
| Use lowercase italic p | Use P, or "P-Value" mid-sentence |
The phrase "approaching significance" for p = 0.07 deserves special mention. It is not a real category — p was either above or below the threshold you set. If the finding is interesting, describe the effect size and confidence interval and let the reader judge.
Where p-values still earn their place
The criticism has become fashionable enough that it is worth stating the other side. A p-value is a compact, well-understood answer to a genuinely useful question: could this pattern plausibly have arisen from noise alone? For a pre-registered, adequately powered test of a single primary outcome, it does that job well and reviewers expect it.
The problems arise almost entirely from use outside that setting — many tests, flexible stopping, no pre-specified outcome, and thresholds treated as verdicts. The American Statistical Association's statement on p-values makes exactly this point across six principles, and the Nature comment on retiring statistical significance, signed by more than 800 researchers, argues against the threshold rather than the statistic.
For the surrounding procedure, see our guide to the five steps of hypothesis testing; for choosing what to run in the first place, how to choose the right statistical test; and for the broader set of traps, 10 common statistical mistakes in research. If your analysis is heading for examination or publication, our statistical and research data analysis service covers the reporting standards reviewers expect.
The bottom line
A p-value is a useful signal, not a verdict. It tells you how surprising your data would be if there were no effect — and that is all. Combine it with effect sizes, honest reporting, and good judgement, and it becomes genuinely informative.
Frequently Asked Questions
What does a p-value of 0.05 actually mean?
It means that if the null hypothesis were true, you would see data at least this extreme about 5% of the time. It does not mean there is a 5% chance the null is true, and it does not measure how large or important the effect is.
Is a lower p-value better?
Lower means stronger evidence against the null, but not a bigger or more useful effect. A very low p-value in a very large dataset often accompanies an effect too small to act on. Read it with the effect size.
What does p = 0.000 mean in SPSS?
It means the p-value is smaller than 0.0005 and SPSS has rounded to three decimals. A p-value can never be exactly zero. Report it as p < 0.001.
Why is p = 0.06 not significant?
Because 0.05 is the threshold convention, and 0.06 is above it. The number itself is barely different from 0.049. If your result sits near the line, report the effect size and confidence interval and describe the finding as inconclusive rather than absent.
Should I use p-values or confidence intervals?
Report both where you can. The confidence interval contains the information the p-value carries and adds the effect magnitude and precision, which is what most readers actually need to make a decision.
What is p-hacking?
Running many analyses, subgroups or model specifications and reporting only the ones that reached significance. It reliably produces false positives. The defences are pre-registering your primary outcome, correcting for multiple comparisons, and disclosing every test you ran.
Need help turning your data into defensible results? DSTechnoverse offers statistical and research data analysis services in SPSS, R, and Python — survey analysis, thesis and dissertation support, and business statistics. Get in touch to discuss your dataset.