
Every research project eventually faces the question: are you working with numbers or words? The answer shapes your entire analysis. Here is how qualitative and quantitative analysis differ, and when to use each.
Quantitative analysis: the numbers
Quantitative analysis works with numerical data and uses statistics to find patterns, test hypotheses, and generalise.
- Data: counts, measurements, scale ratings, survey responses
- Tools: SPSS, R, Python, Excel
- Methods: descriptive statistics, t-tests, ANOVA, regression
- Answers: how many, how much, how often, is there a significant difference?
- Strength: results that generalise to a wider population
- Best for: measuring, comparing, predicting
Qualitative analysis: the words
Qualitative analysis works with non-numerical data to understand meaning, experience, and context.
- Data: interviews, open-ended responses, focus groups, observations, documents
- Tools: NVivo, ATLAS.ti, or manual coding
- Methods: thematic analysis, content analysis, grounded theory
- Answers: why, how, what does it mean, what is the experience?
- Strength: depth, nuance, and rich understanding
- Best for: exploring, explaining, understanding
A quick comparison
| Aspect | Quantitative | Qualitative |
|---|---|---|
| Data | Numbers | Words |
| Question | How much / how many | Why / how |
| Sample | Larger | Smaller, purposive |
| Result | Generalisable | Deep, contextual |
| Analysis | Statistics | Coding & themes |
When to use which
- Use quantitative when you need to measure, compare groups, or test a hypothesis at scale.
- Use qualitative when you need to explore a new area, understand experiences, or explain why something happens.
Mixed methods: the best of both
Many strong studies combine the two. For example: a survey (quantitative) reveals that satisfaction dropped, and follow-up interviews (qualitative) reveal why. The numbers show the pattern; the narratives explain it.
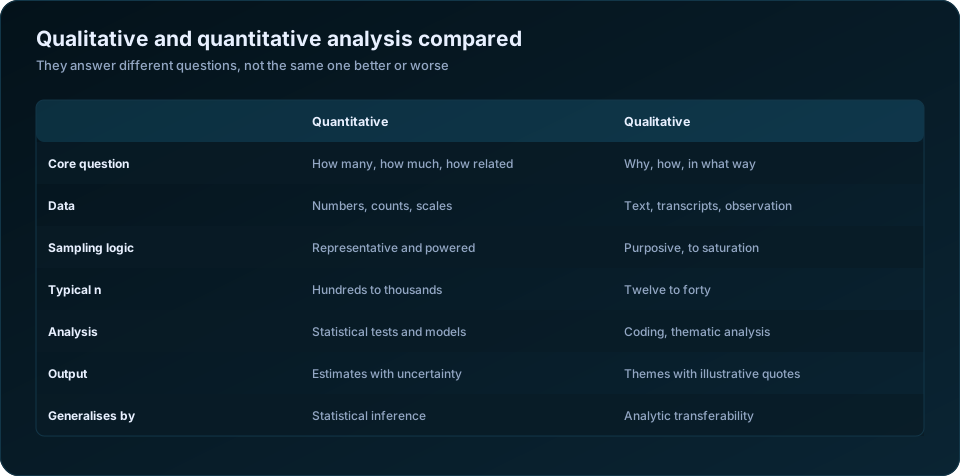
The comparison in full
| Quantitative | Qualitative | |
|---|---|---|
| Core question | How many, how much, how strongly related | Why, how, in what way, under what conditions |
| Data | Numbers, counts, scale scores | Transcripts, field notes, documents, images |
| Sampling logic | Representative and powered | Purposive, continued to saturation |
| Typical sample size | Hundreds to thousands | Twelve to forty |
| Instrument | Structured questionnaire | Interview guide, observation protocol |
| Analysis | Statistical tests and models | Coding, categorising, thematic development |
| Software | SPSS, R, Stata, Python | NVivo, ATLAS.ti, Dedoose, MAXQDA |
| Output | Estimates with quantified uncertainty | Themes supported by illustrative quotes |
| Claim to generality | Statistical inference to a population | Analytic transferability to similar settings |
| Quality criteria | Reliability, validity, power | Credibility, dependability, confirmability |
| Where it fails | Cannot explain an unexpected result | Cannot tell you how common something is |
The bottom two rows carry most of the practical weight. A quantitative study can tell you that 34% of households abandoned a scheme and cannot tell you why. A qualitative study can tell you the four reasons people gave for abandoning it and cannot tell you which reason dominates. Neither weakness is a flaw in the method; each is the price of what the method buys.
How qualitative analysis actually works
The most common misconception is that qualitative analysis means reading transcripts and forming impressions. Done properly it is a structured, auditable procedure.
| Stage | What happens |
|---|---|
| Familiarisation | Read every transcript once without coding, to grasp the whole |
| Open coding | Label segments with descriptive codes, staying close to the words used |
| Code consolidation | Merge duplicates, split codes doing two jobs, build a codebook |
| Categorising | Group related codes into broader categories |
| Theme development | Identify patterns that answer the research question |
| Checking | Return to the data and test each theme against disconfirming cases |
| Reporting | Present themes with quotes, and state how prevalent each was |
Two disciplines separate rigorous qualitative work from anecdote. Double coding: a second researcher codes a subset independently, and disagreements are discussed rather than averaged away. Negative case analysis: actively searching for data that contradicts an emerging theme, and either revising the theme or explaining the exception. A qualitative analysis with no disconfirming cases mentioned has usually not looked for them.
Saturation is the sampling rule. You stop interviewing when additional interviews stop producing new codes. In practice this typically arrives between twelve and twenty-five interviews for a reasonably homogeneous group, and later for a diverse one. It is a defensible stopping rule and should be reported: "saturation was reached at interview 17; three further interviews confirmed no new themes."
Mixed methods: the four designs
Combining the two is not a matter of doing both and stapling them together. There are four recognised designs, and choosing one shapes your entire timeline.
| Design | Sequence | Use when |
|---|---|---|
| Explanatory sequential | Quantitative, then qualitative | Numbers produced a result you need to explain |
| Exploratory sequential | Qualitative, then quantitative | You need to understand the concept before you can measure it |
| Convergent parallel | Both at once, compared at analysis | You want two independent readings of the same question |
| Embedded | One nested inside the other | A small qualitative component within a large trial |
Exploratory sequential is the most under-used and the most valuable for new instruments. Before designing a questionnaire about, say, barriers to scheme uptake, twenty open interviews will surface response categories you would never have thought to offer. Skipping this step is how surveys end up with an "other, please specify" box that collects a third of all responses.
Explanatory sequential is the most common in evaluation work. A baseline and endline study shows the programme worked in three districts and not in the fourth; a set of interviews in that fourth district explains what happened. The quantitative result poses the question; the qualitative work answers it.
Choosing, by research question
| Your question | Approach |
|---|---|
| How many households have piped water? | Quantitative |
| Did the training increase incomes? | Quantitative |
| Why do people stop attending after two sessions? | Qualitative |
| What does "empowerment" mean to women in this district? | Qualitative |
| Which factors predict adoption? | Quantitative |
| How does the scheme work in practice, day to day? | Qualitative |
| Did it work, and why did it work where it did? | Mixed, explanatory sequential |
| What should we even be measuring here? | Mixed, exploratory sequential |
Read the verb in your research question. "How many", "how much", "does X affect Y", "which predicts" are quantitative. "Why", "how", "what does it mean", "in what way" are qualitative. Questions containing both need a mixed design, and pretending otherwise produces a study that half-answers each.
What each one cannot rescue
A common and expensive error is reaching for one method to fix a failure in the other.
Adding qualitative interviews will not rescue an underpowered quantitative study. If your survey could not detect the effect, twelve interviews cannot establish that it exists — they can only describe mechanisms.
Adding a survey will not rescue thin qualitative work. Counting how many of your fifteen interviewees mentioned a theme does not turn purposive sampling into a population estimate, and reporting "60% of respondents said" about fifteen people is misleading precision.
For the quantitative side see descriptive vs inferential statistics and how to choose the right statistical test. For designing the instruments, how to design a baseline survey questionnaire. Our socio-economic and baseline survey service runs mixed-method studies end to end, and the COREQ reporting checklist is the standard for writing up qualitative work credibly.
The takeaway
Neither approach is superior — they answer different questions. Let your research question drive the choice. And if your project needs both, a mixed-methods design often produces the richest, most convincing findings.
Frequently Asked Questions
What is the main difference between qualitative and quantitative analysis?
Quantitative analysis works with numbers to establish how much, how many and how strongly variables relate, generalising to a population through statistical inference. Qualitative analysis works with text and observation to establish why and how something happens, generalising analytically to similar settings.
Can you combine qualitative and quantitative methods?
Yes — mixed methods designs are standard in evaluation and social research. The four main designs are explanatory sequential, exploratory sequential, convergent parallel and embedded. Choose one deliberately rather than running both and combining the reports at the end.
How many interviews are enough for qualitative research?
Until saturation, when new interviews stop producing new codes. For a homogeneous group this is typically twelve to twenty-five; a diverse sample needs more. Report the point at which saturation was reached and the evidence for it.
Is qualitative research less rigorous than quantitative?
No, but it is rigorous differently. Its quality criteria are credibility, dependability, confirmability and transferability, achieved through double coding, negative case analysis, audit trails and member checking. Unstructured impressions are not qualitative research, just as an unpowered survey is not quantitative research.
Which method should I use for my dissertation?
Read the verb in your research question. "How many" and "does X affect Y" point to quantitative; "why" and "how" point to qualitative. If your question genuinely contains both, use a mixed design and say which strand leads.
Can I report percentages from qualitative interviews?
Better to use language such as "most", "several" or "a few", or to state raw counts out of the total. Percentages from a purposive sample of fifteen imply a precision the sampling method cannot support.
Need help turning your data into defensible results? DSTechnoverse offers statistical and research data analysis services in SPSS, R, and Python — survey analysis, thesis and dissertation support, and business statistics. Get in touch to discuss your dataset.