
People spend roughly 90% of their lives indoors, which makes indoor concentration — not ambient concentration — the dominant determinant of actual exposure. Yet indoor air quality receives a fraction of the analytical attention that ambient monitoring does, is regulated far more loosely, and is frequently assessed with a handheld meter and no protocol at all. That gap between exposure significance and analytical rigour is where most indoor air quality problems live.
This guide covers indoor air quality analysis properly: which parameters matter and why, how indoor and outdoor air interact, the ventilation metrics that explain most problems, sampling protocols, applicable standards, and how a diagnosis leads to a fix.
Indoor air quality analysis is the systematic assessment of pollutant concentrations, ventilation performance and thermal conditions inside buildings, combining continuous and grab sampling of parameters such as PM2.5, CO2, VOCs, formaldehyde, CO and radon with measurement of air exchange rates and indoor-to-outdoor ratios, to diagnose the balance between outdoor infiltration, indoor sources and inadequate ventilation.
The Governing Equation
Indoor concentration is not arbitrary. For a well-mixed space at steady state:
C_indoor ≈ (P × a × C_outdoor) / (a + k) + E / (V × (a + k))
Where:
- P = penetration factor (fraction of outdoor pollutant entering through the envelope)
- a = air exchange rate (air changes per hour, ACH)
- k = indoor loss rate (deposition, filtration, chemical reaction)
- C_outdoor = outdoor concentration
- E = indoor emission rate
- V = volume of the space
Two terms, two mechanisms. The first is infiltration of outdoor pollution; the second is indoor generation. Every indoor air quality problem is one, the other, or both — and the entire analytical task is deciding which.
The equation also explains a counter-intuitive result: increasing ventilation lowers indoor-generated pollutants but raises the indoor concentration of outdoor-origin pollutants. In a city with 150 µg/m³ ambient PM2.5, opening the windows makes indoor air worse, not better. Ventilation is only a solution when outdoor air is cleaner than indoor air, or when it is filtered.
Parameters That Matter Indoors
Carbon dioxide — the ventilation proxy
CO2 is not usually a health hazard at indoor concentrations, but it is the single most useful indoor measurement because it is a direct proxy for ventilation adequacy in occupied spaces. People exhale CO2 at a predictable rate, so the steady-state indoor concentration reveals how much outdoor air is being supplied per person.
| Indoor CO2 (ppm) | Interpretation |
|---|---|
| ~420 (outdoor ambient) | Reference baseline |
| < 800 | Good ventilation |
| 800–1,000 | Acceptable; the common design target |
| 1,000–1,500 | Marginal; complaints of stuffiness typically begin |
| 1,500–2,500 | Poor ventilation; measurable cognitive effects reported |
| > 2,500 | Seriously under-ventilated |
The decay method uses this directly: seal an unoccupied room, release a CO2 pulse, and measure the exponential decay. The decay constant is the air exchange rate.
Particulate matter
Indoor PM2.5 comes from both directions. Outdoor-origin PM penetrates with a factor typically 0.5–0.8 in naturally ventilated buildings and much lower in filtered mechanical systems. Indoor sources — cooking, incense, candles, smoking, printers, vacuuming, resuspension from movement — can produce short-duration concentrations far above anything outdoors.
Solid-fuel cooking deserves separate mention: in households using biomass or coal in poorly ventilated kitchens, peak PM2.5 can exceed 1,000 µg/m³, and household air pollution is a leading risk factor in India's disease burden.
Volatile organic compounds
Indoor VOC concentrations typically run 2–10 times outdoor levels because the sources are inside: paints, adhesives, sealants, furniture, carpets, cleaning products, air fresheners, printers, and personal care products.
Formaldehyde deserves individual attention. Emitted by pressed-wood products, adhesives and some insulation, it is a recognised carcinogen with irritation thresholds low enough that occupants notice it, and its emission rate rises with temperature and humidity — which is why complaints often appear in summer.
TVOC (total VOC) is widely measured by low-cost PID sensors and widely over-interpreted. It is a rough screening indicator; a high TVOC reading warrants speciated sampling, not a conclusion.
Carbon monoxide
Any combustion appliance indoors — gas stove, geyser, generator, heater — is a potential CO source. Unlike most indoor pollutants, CO can be acutely lethal, so its measurement is a safety function as much as an air quality one. An elevated indoor CO reading is an immediate action item, not an analytical finding.
Radon
A naturally occurring radioactive gas from uranium decay in soil and rock, entering through foundation cracks and accumulating in poorly ventilated ground-floor and basement spaces. It is the second leading cause of lung cancer globally. Measurement requires long-duration passive detectors (alpha-track or electret) over months, because concentrations vary seasonally — a one-day measurement is meaningless.
Bioaerosols and dampness
Mould spores, bacteria and dust mite allergens are associated with damp buildings. Sampling is done by settle plates, impaction samplers or surface swabs, but interpretation is genuinely difficult because there are no widely accepted numerical limits. The stronger diagnostic is usually a moisture survey: visible mould, elevated surface moisture, and relative humidity persistently above 60% are more actionable than a spore count.
Thermal and comfort parameters
Temperature, relative humidity and air velocity are not pollutants but they determine both perceived air quality and pollutant behaviour. Relative humidity below 30% causes mucosal irritation; above 60% it promotes mould and dust mites. Many "air quality complaints" are thermal comfort problems.
The Indoor/Outdoor Ratio — the Key Diagnostic
Measuring indoors and outdoors simultaneously and taking the ratio is the fastest way to identify where a problem originates.
| I/O ratio | Interpretation | Implication |
|---|---|---|
| < 0.3 | Effective filtration or high deposition | Mechanical system with good filtration working well |
| 0.3–0.7 | Typical for outdoor-origin pollutants with normal envelope | Infiltration-dominated, no significant indoor source |
| 0.7–1.0 | High infiltration, minimal filtration | Naturally ventilated building tracking outdoor air |
| > 1.0 | Indoor source present | Investigate indoor emissions |
| >> 1.0 (e.g. 3–10) | Strong indoor source | Cooking, combustion, smoking, materials off-gassing |
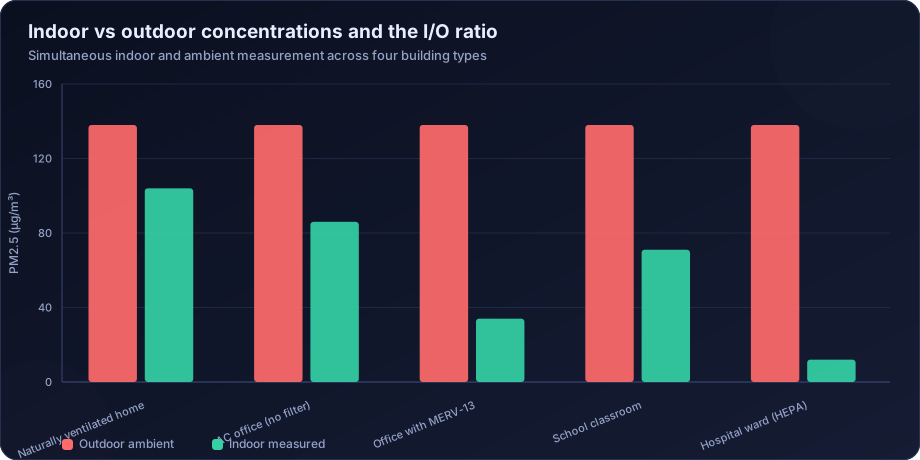
The chart above shows the pattern clearly. The naturally ventilated home has an I/O of about 0.75 — it is simply tracking outdoor air. The office with MERV-13 filtration achieves 0.25. The HEPA-equipped ward reaches 0.09. Same outdoor air, four very different indoor outcomes, and the difference is entirely engineering.
Simultaneity matters. An indoor measurement at 10:00 compared against an outdoor measurement at 15:00 produces a ratio that means nothing. Instruments must run concurrently, ideally the same make and model at both locations to eliminate inter-instrument bias.
Ventilation Metrics
| Metric | Definition | Typical target |
|---|---|---|
| Air changes per hour (ACH) | Room volumes of outdoor air supplied per hour | 0.35–1.0 residential; 4–6 offices; 6–12 labs |
| Ventilation rate per person | Litres per second per occupant | 8–10 L/s/person for offices |
| Ventilation rate per floor area | L/s per m² | Applied together with the per-person rate |
| Air exchange effectiveness | How well supplied air reaches the breathing zone | 1.0 for ideal mixing |
| Filter efficiency | MERV, ISO 16890 or HEPA class | MERV 13+ where ambient PM is high |
Measurement methods: CO2 decay (simple, needs an unoccupied space), tracer gas decay using SF6 or another inert tracer (more accurate), constant injection tracer (for continuous measurement), and blower door testing for envelope airtightness rather than operational ventilation.
The ASHRAE 62.1 standard is the international reference for ventilation rates in commercial buildings; ISO 16000 series covers indoor air measurement methods; and India's National Building Code prescribes ventilation requirements alongside sector-specific guidance for workplaces.
Standards and Guidelines
Indoor air quality is regulated much less tightly than ambient air, and the applicable framework depends on the building type.
| Framework | Scope | Nature |
|---|---|---|
| WHO indoor air quality guidelines | Selected pollutants; household fuel combustion | Health-based, non-statutory |
| ASHRAE 62.1 / 62.2 | Ventilation for commercial and residential buildings | Design standard, widely adopted |
| ISO 16000 series | Measurement methods for indoor air | Method standard |
| National Building Code of India | Ventilation and services | Regulatory in adopting jurisdictions |
| Factories Act and workplace rules | Occupational exposure limits | Statutory for workplaces |
| Green building rating systems (LEED, IGBC, GRIHA) | IAQ credits and testing protocols | Voluntary certification |
| WELL Building Standard | Comprehensive occupant health | Voluntary certification |
An important distinction: occupational exposure limits are not indoor air quality guidelines. OELs are set for healthy adult workers over an eight-hour shift with monitoring and controls in place. They are typically far higher than concentrations appropriate for a general population including children, older adults and people with existing conditions, over 24 hours. Applying an OEL to a school or a residence is a serious methodological error.
The Assessment Protocol
- Walkthrough and occupant interview. Before any instrument is deployed. Complaint patterns — which rooms, which times of day, which symptoms, whether symptoms resolve away from the building — narrow the hypothesis space enormously.
- Building and system review. HVAC design and actual operation, filter type and condition, outdoor air damper position, recirculation fraction, exhaust systems, recent renovations, furniture and material changes.
- Screening measurements. CO2, temperature, RH, PM2.5, CO and TVOC across zones, including simultaneous outdoor measurement.
- Targeted sampling. Based on screening results — speciated VOCs by sorbent tube and GC-MS, formaldehyde by DNPH cartridge, bioaerosols where dampness is present, radon by long-duration passive detector.
- Ventilation measurement. CO2 decay or tracer gas to establish actual air exchange rate against the design intent.
- Temporal characterisation. Continuous logging over at least a week to capture occupied and unoccupied periods, weekday and weekend, and the diurnal pattern. A single spot reading is almost never diagnostic.
- Source identification. I/O ratios by pollutant, spatial gradients within the building, and temporal correlation with activities.
- Interpretation and recommendations. Ranked by expected effect and cost.
Interpreting the Result: Three Diagnoses
Nearly every indoor air quality problem resolves into one of three diagnoses, and they have different fixes.
Diagnosis 1: Outdoor air is the problem. High I/O ratio, indoor concentration tracking outdoor, no indoor source signature. The fix is filtration — upgrade to MERV 13 or better, seal the envelope, and pressurise with filtered air. Increasing unfiltered ventilation makes it worse.
Diagnosis 2: Indoor sources dominate. I/O ratio above 1, indoor peaks correlated with activities, spatial gradient pointing to a location. The fix is source control first — remove or substitute the emitting material, add local exhaust at the source — and increased ventilation second.
Diagnosis 3: Ventilation is inadequate. Elevated CO2, low measured ACH, complaints concentrated in the afternoon and in densely occupied rooms. The fix is ventilation system commissioning, damper adjustment, and where necessary capacity increase with appropriate filtration.
The reason the diagnosis must come first is that the fixes conflict. Increasing ventilation is correct for Diagnosis 3 and actively harmful for Diagnosis 1.
How DSTechnoverse Helps
DSTechnoverse conducts indoor air quality assessments for offices, industrial facilities, healthcare buildings, educational institutions and residential developments.
- Assessment design — protocol built around the specific complaint or objective, covering parameter selection, sampling locations, duration and the simultaneous outdoor reference.
- Measurement — continuous logging of PM2.5, PM10, CO2, CO, TVOC, temperature and humidity, with targeted speciated sampling for VOCs, formaldehyde, bioaerosols and radon where indicated.
- Ventilation performance testing — CO2 decay and tracer gas measurement of actual air exchange rates against design and standard requirements.
- Source diagnosis — I/O ratio analysis by pollutant, spatial mapping within the building, and temporal correlation with occupancy and activity.
- Interpretation against the right benchmark — WHO guidelines, ASHRAE ventilation requirements, green building criteria or occupational limits as appropriate, with the distinction between them made explicit.
- Remediation recommendations — ranked by expected effect and cost, covering source control, filtration upgrades, ventilation commissioning and operational changes.
- Verification — post-remediation measurement to confirm the intervention worked, which is the step most often skipped.
Where indoor exposure feeds a broader exposure or health assessment, we integrate it with ambient data and health risk assessment, because total personal exposure is what determines health outcome — not the ambient monitor reading alone.
Need air quality data turned into a defensible answer? DSTechnoverse provides end-to-end air quality analysis services — monitoring data validation, statistical analysis, source apportionment, dispersion modelling, GIS mapping, and regulator-ready reporting. Talk to our air quality team about your dataset or project.
Frequently Asked Questions
What parameters should be measured in an indoor air quality assessment?
At minimum CO2 as a ventilation proxy, PM2.5, temperature and relative humidity, with simultaneous outdoor measurement. Depending on the building and the complaint, add CO where combustion appliances exist, speciated VOCs and formaldehyde where materials or odours are implicated, bioaerosols where dampness is present, and radon in ground-floor or basement spaces.
What is a good indoor CO2 level?
Below 800 ppm indicates good ventilation and below 1,000 ppm is the common design target. Between 1,000 and 1,500 ppm ventilation is marginal and stuffiness complaints typically begin. Above 1,500 ppm the space is under-ventilated, and above 2,500 ppm seriously so.
What does the indoor/outdoor ratio tell you?
It identifies where a pollutant originates. A ratio below about 0.7 indicates the indoor concentration is driven by outdoor air entering the building. A ratio above 1.0 indicates an indoor source. The ratio must be computed from simultaneous measurements, ideally with identical instruments indoors and outdoors.
Does opening windows improve indoor air quality?
Only if outdoor air is cleaner than indoor air. Where ambient PM2.5 is high, natural ventilation increases indoor concentrations of outdoor-origin pollution. In polluted urban settings the correct approach is a sealed envelope with mechanical ventilation through effective filtration, not open windows.
Are occupational exposure limits appropriate for offices and schools?
No. Occupational limits are set for healthy adult workers over an eight-hour shift in a controlled and monitored environment, and are typically far higher than concentrations appropriate for continuous exposure of a general population including children and people with existing conditions. Applying them to non-industrial settings substantially understates risk.
How long should indoor air quality monitoring run?
At least a full week of continuous logging, so that occupied and unoccupied periods, weekdays and weekends, and the daily cycle are all captured. Spot measurements rarely diagnose anything because indoor concentrations vary enormously with occupancy, activity and HVAC operation. Radon requires months.
What is the most common cause of indoor air quality complaints?
Inadequate ventilation, usually revealed by elevated CO2 and confirmed by a measured air exchange rate below design. The second most common is an indoor emission source such as recently installed materials, cleaning products or a combustion appliance. Thermal comfort problems are also frequently reported as air quality complaints.
Can low-cost sensors be used for indoor air quality?
Yes, and more defensibly than for regulatory ambient work, because indoor assessment often concerns relative change, spatial comparison and temporal patterns rather than absolute regulatory compliance. They still require calibration and a stated uncertainty, and TVOC sensors in particular should be treated as screening indicators that trigger speciated sampling rather than as quantitative measurements.
Related services
Related articles
- Air Quality Analysis: The Complete Guide to Parameters, Methods and Data Interpretation
- Air Quality Compliance Reporting Against NAAQS: Percentiles, Exceedances and Defensible Statistics
- Air Quality Forecasting with Machine Learning: Models, Features and Honest Validation
- Air Quality GIS Mapping: Spatial Interpolation, Kriging and Exposure Surfaces