Quick answer: A flight's carbon footprint is estimated from the fuel it burns: distance and aircraft set the fuel, each kilogram of jet fuel releases about 3.16 kg of CO2, and the total is shared between passengers according to how full the plane is and how much space each cabin class takes. A one-way economy flight from Delhi to Mumbai is roughly 80 to 110 kg of CO2 per passenger, and a Delhi to London flight roughly 500 to 600 kg, before any allowance for non-CO2 effects.
Type "flight carbon footprint calculator" into two different tools for the same trip and you will often get two different numbers. That is not because one is wrong — it is because a flight's footprint depends on several variables, and different calculators weight them differently. Use the calculator below for a quick estimate, then read on to see what goes into the number and how to use it for reporting or offsetting.
It Starts With Fuel, So It Starts With Distance
A flight's CO2 comes from the fuel it burns, and fuel burn scales — roughly — with distance. Longer flights burn more fuel and emit more CO2 in total. But per kilometre the picture is subtler: take-off and climb are the most fuel-hungry phases, so very short flights are surprisingly inefficient per kilometre, while the cruise phase of a long flight is more efficient per kilometre even though the total is large.
The Formula, Step by Step
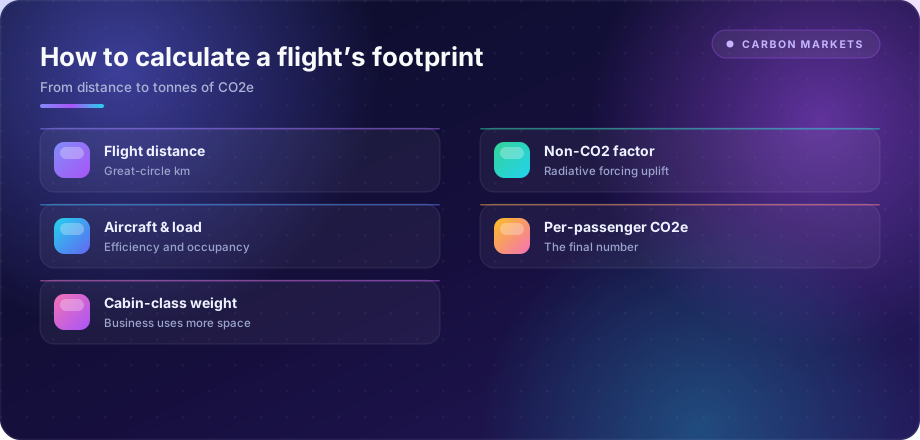
Most calculators follow the same chain, whatever their exact factors:
- Distance. The great-circle distance between the two airports, the shortest path over the Earth's surface, usually with an uplift for real-world routing, holding patterns and taxiing. Many methods add around 8%, or a fixed number of kilometres.
- Fuel burn. Estimated for that distance from aircraft performance data, either for the specific aircraft type or an average for the route type.
- CO2 from fuel. Burning one kilogram of jet fuel (Jet A or Jet A-1) produces about 3.16 kg of CO2. This is the factor ICAO uses, and it is the same one airlines use for CORSIA reporting.
- Share for passengers. Part of the fuel carries cargo and mail in the hold, so a share is allocated to freight first; the rest is divided between passengers.
- Load factor. The passenger share is divided by the number of passengers actually on board, typically 75% to 85% of seats.
- Cabin class. Premium seats take more floor space, so they are allocated more: business class is often 1.5 times economy on short flights and around 3 times on long-haul flights with lie-flat seats.
- Non-CO2 effects (optional). Some methods multiply CO2 by a factor, often around 1.7 to 1.9, to reflect the extra warming from contrails and nitrogen oxides at altitude, and report the result as CO2e.
Worked Example: Delhi to Mumbai
Take a one-way Delhi to Mumbai flight on an A320-family aircraft with 180 seats:
| Step | Assumption | Result |
|---|---|---|
| Distance | Great-circle about 1,140 km | 1,140 km |
| Fuel burn | About 4,000 kg for the trip, including taxi | 4,000 kg |
| CO2 | 4,000 × 3.16 | 12,640 kg CO2 |
| Passenger share | 95%, with 5% allocated to cargo | 12,008 kg |
| Passengers | 80% load factor, 144 passengers | |
| Per passenger (economy) | 12,008 ÷ 144 | about 83 kg CO2 |
| With a non-CO2 multiplier of 1.7 | 83 × 1.7 | about 141 kg CO2e |
The figures are illustrative; actual fuel burn depends on the aircraft variant, weather, routing and weight. The distance-based calculator above gives about 105 kg for the same trip, because it uses an average factor and adds an uplift for routing. Both are reasonable estimates, which is exactly why calculators differ.
Typical Footprints for Common Routes
One-way, per passenger, economy, CO2 only, using the calculator's indicative factors:
| Route | Approx. distance | Estimated CO2 |
|---|---|---|
| Indore – Mumbai | 510 km | about 47 kg |
| Delhi – Mumbai | 1,140 km | about 105 kg |
| Delhi – Bengaluru | 1,705 km | about 144 kg |
| Mumbai – Dubai | 1,930 km | about 163 kg |
| Delhi – Dubai | 2,190 km | about 185 kg |
| Mumbai – Singapore | 3,900 km | about 329 kg |
| Delhi – London | 6,710 km | about 544 kg |
| Delhi – New York | 11,760 km | about 953 kg |
Double these for a return trip, multiply by about 2.9 for long-haul business class, and by about 1.7 if your method includes non-CO2 effects. For comparison, the average person in India is responsible for roughly two tonnes of CO2 a year from all sources, so a single return long-haul business-class trip can exceed a year's average footprint.
The Variables That Change the Number
Beyond distance, four factors move a per-passenger footprint:
| Factor | Effect on the footprint |
|---|---|
| Aircraft type & age | Newer, efficient aircraft burn less |
| Load factor (how full) | More passengers share the emissions |
| Cabin class | Premium seats take more space and weight |
| Non-CO2 uplift | An optional multiplier for altitude effects |
Cabin class matters more than people expect: a business-class seat can be allocated several times the emissions of an economy seat on the same flight, because it occupies far more of the cabin. Direct flights also matter: a connection adds an extra take-off and climb, the most fuel-intensive part of a flight, and often extra distance.
Where Aviation Emissions Come From
Almost all of aviation's direct climate impact comes from burning jet fuel. Kerosene combusts to CO2 and water vapour, and the CO2 is the core measured emission behind carbon accounting and schemes like CORSIA. At altitude, aircraft also produce contrails, which can form cirrus clouds that trap heat, and nitrogen oxides, which affect atmospheric chemistry in warming ways. These non-CO2 effects may roughly double aviation's warming impact beyond CO2 alone, but most carbon accounting, and CORSIA, cover only CO2.
Two accounting distinctions matter. International flights sit under CORSIA, while domestic aviation falls under national policy. And a flight's emissions are always allocated per passenger, with premium cabins taking a larger share.
Why Aviation Is So Hard to Decarbonise
Most sectors have a clear electric path. Aviation does not — yet. Batteries are far too heavy for long-haul, the energy density of jet fuel is hard to match, and the aircraft flying today will be in service for decades. That is why aviation leans on a stack of partial solutions — efficiency, sustainable aviation fuel, new propulsion for short-haul, and carbon markets as a bridge — rather than one silver bullet, as explored in can carbon markets cut aviation emissions.
The Non-CO2 Question
Here is the biggest reason calculators diverge. Flying's warming impact is not only CO2 — contrails and NOx at altitude add substantially. Some calculators apply a radiative forcing multiplier (often around 1.7–2×) to reflect this; others report CO2 only. That single choice can nearly double the result, which is why comparing calculators means checking whether they include non-CO2 effects.
There is no single correct answer. The science on non-CO2 effects is less certain than on CO2, and the effect depends on altitude, weather and time of day. For company reporting, follow the method your reporting framework specifies and state clearly whether non-CO2 effects are included.
From Fuel to CO2e
Once fuel burn is estimated, it is converted to CO2 using standard factors, allocated per passenger by cabin class, and — if the tool includes it — uplifted for non-CO2 effects, giving a final figure in CO2e. That per-passenger CO2e is what a passenger offset, or a company's business-travel footprint, is based on.
Which Calculator or Factors to Use
- ICAO Carbon Emissions Calculator: the UN aviation agency's public calculator, based on fuel burn by aircraft type and route data. It reports CO2 only, which makes it suitable when you want a fuel-based, airline-neutral figure.
- National emission factor sets: several governments publish per passenger-km factors by flight length and cabin, with and without non-CO2 effects. The UK government's greenhouse gas conversion factors are widely used by companies worldwide for this reason.
- Airline-specific data: some airlines publish emissions per flight or per passenger; useful for comparisons, but methods vary.
- Travel management platforms: corporate booking tools often calculate emissions per trip automatically, usually using one of the factor sets above.
Choose one method, document it, and apply it consistently across years so trends are meaningful.
Flight Emissions in Corporate Reporting
For companies, employee flights fall under Scope 3, Category 6 (business travel) of the GHG Protocol. Three approaches are common:
| Method | How it works | Accuracy |
|---|---|---|
| Distance-based | Each trip's distance and cabin class multiplied by emission factors | Good; the standard approach |
| Spend-based | Money spent on air travel multiplied by an emissions-per-rupee factor | Rough; used when trip data is missing |
| Supplier-specific | Emissions data reported by the airline or travel agency for each booking | Best when the method is transparent |
In India, listed companies report under SEBI's Business Responsibility and Sustainability Reporting (BRSR) framework, where Scope 3 emissions such as business travel are a leadership indicator. Getting trip-level data from your travel agency, including origin, destination and cabin, makes the calculation straightforward.
How Airlines Calculate Their Emissions
Airlines do not use distance factors for their own reporting. Under CORSIA and national schemes, they measure fuel actually used on each flight, from fuel uplift records or block-on/block-off fuel readings, and multiply by the fuel's emission factor (3.16 for Jet A and Jet A-1). That operator-level figure is what drives their offsetting obligations. See CORSIA emission factors and fuel types and how flight distance is established for CORSIA.
Reducing and Offsetting Flight Emissions
The most effective steps, in order:
- Avoid trips that a video call can replace, especially short internal meetings.
- Choose rail for short routes where a good train service exists.
- Fly economy and direct when you do fly; cabin class and connections change the footprint more than most other choices.
- Choose efficient airlines and aircraft where you have the option.
- Offset what remains with high-quality credits, ideally durable removals, and report offsets separately from reductions.
See business travel emissions: measure, reduce and offset and airline carbon offset programs for more detail.
Frequently Asked Questions
Does CORSIA cover non-CO2 effects? No. CORSIA accounts only for CO2 from fuel burned on international flights; contrails and nitrogen oxides are a separate scientific and policy question.
Why is aviation hard to decarbonise? Batteries are too heavy for long-haul flights, jet fuel's energy density is hard to replace, and aircraft stay in service for decades, so the sector relies on efficiency, sustainable aviation fuel and carbon markets.
How is a flight's carbon footprint calculated? From the fuel burned (driven by distance, aircraft and load), converted to CO2, allocated per passenger by cabin class, and often uplifted for non-CO2 effects to give CO2e.
How much CO2 does a flight produce per passenger? Roughly 75 to 110 grams of CO2 per passenger-kilometre in economy, depending on distance and aircraft. That is about 100 kg for Delhi to Mumbai one way and about 550 kg for Delhi to London.
How much CO2 does one kilogram of jet fuel produce? About 3.16 kg of CO2, the factor used by ICAO and for CORSIA reporting.
Why do flight calculators give different results? Mainly because some include a non-CO2 (radiative forcing) multiplier and others report CO2 only, and they make different assumptions about aircraft and load.
Does business class have a bigger footprint than economy? Yes — premium seats are allocated more emissions because they occupy more of the cabin's space and weight per passenger.
What is the non-CO2 multiplier? An uplift (often around 1.7–2×) applied to reflect the extra warming from contrails and nitrogen oxides at altitude, beyond CO2.
Are short flights worse per kilometre? Often yes — take-off and climb are the most fuel-intensive phases, so short hops can be inefficient per kilometre despite a smaller total.
Is a direct flight better than a connecting flight? Usually. A connection adds a second take-off and climb and often extra distance, so a direct flight typically has a lower footprint for the same trip.
Which scope are business flights in? Scope 3, Category 6 (business travel) under the GHG Protocol, for the company whose employees travel.
How do I offset a flight? Calculate the footprint, then buy and retire carbon credits for that amount from a reputable registry, preferably high-quality or removal credits, and keep the retirement record.
Buying carbon credits or measuring travel and freight emissions? DSTechnoverse works on the data and integrity side of carbon — footprint measurement, project screening, registry and eligibility verification, and defensible reporting. See our CORSIA carbon credit services and data analytics. We are based in Indore, Madhya Pradesh and work across India and internationally.
Apply as a carbon credit buyer or seller
Talk to our team, or start with the complete carbon credits guide.