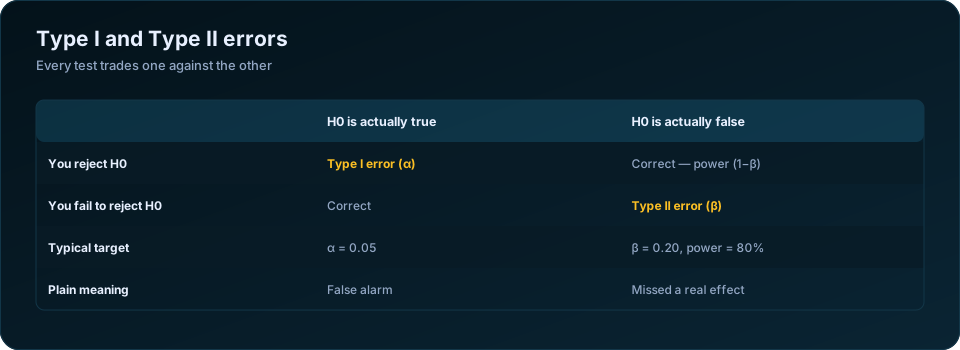
Every hypothesis test can be wrong in exactly two ways, and you get to choose which one you would rather risk. Most analyses never make that choice consciously — they inherit α = 0.05 from a textbook and never think about β at all.
The Two-by-Two That Explains Everything
| H₀ is actually true | H₀ is actually false | |
|---|---|---|
| You reject H₀ | Type I error (α) — false alarm | Correct decision — power (1−β) |
| You fail to reject H₀ | Correct decision | Type II error (β) — missed effect |
- Type I error = concluding there is an effect when there is not. Probability α.
- Type II error = failing to detect an effect that is really there. Probability β.
- Power = 1 − β = the probability of detecting a real effect of a given size.
The classic memory aid: Type I is convicting an innocent person; Type II is acquitting a guilty one. A justice system that never convicts the innocent by acquitting everyone has traded one error entirely for the other — which is precisely the trade a hypothesis test makes.
Why You Cannot Minimise Both
At a fixed sample size, α and β move in opposite directions. Demand stronger evidence before declaring an effect (lower α) and you will inevitably miss more real effects (higher β).
| Setting | Type I risk | Type II risk | Consequence |
|---|---|---|---|
| α = 0.10 | Higher | Lower | More false discoveries, fewer misses |
| α = 0.05 | Standard | Standard | The default convention |
| α = 0.01 | Lower | Higher | Confident findings, more missed effects |
There is exactly one way to reduce both at once: collect more data. That is the entire economic argument for sample size planning — you are buying the ability to be simultaneously cautious and sensitive.
Which Error Costs More?
This is a business question, not a statistical one, and it should be answered before the test is designed.
| Situation | Type I error costs | Type II error costs | Should set |
|---|---|---|---|
| Drug safety signal | An unnecessary recall | Patients harmed | Low β — prioritise power |
| New feature rollout | Shipping a feature that does nothing | Missing a real improvement | Balanced |
| Fraud detection alert | Investigating a clean account | Fraud goes through | Depends on fraud value |
| Manufacturing QC | Rejecting good batches | Shipping bad batches | Usually low β |
| Academic publication | A false finding enters the literature | A real finding goes unpublished | Low α by convention |
| Marketing A/B test | Rolling out a neutral change | Missing a small lift | Often α = 0.10 is defensible |
The uncomfortable pattern: the conventional α = 0.05 with power at 80% means you accept a 20% chance of missing a real effect — four times the false-alarm rate you were so careful about. In safety-critical work that ratio is backwards.
Power: The Error Nobody Reports
β is the neglected half of the pair. Studies routinely report α and never mention power, which means readers cannot distinguish "we found no effect" from "we could not have found one".
Standard targets:
| Power | β | Interpretation |
|---|---|---|
| 50% | 0.50 | A coin flip — common in small studies, rarely admitted |
| 80% | 0.20 | Conventional minimum |
| 90% | 0.10 | Preferred for confirmatory work |
| 95% | 0.05 | Regulatory and clinical settings |
An underpowered study is not a cheap version of a proper study. It is an expensive way to produce an uninterpretable result — and worse, when an underpowered study does reach significance, the effect it reports is systematically exaggerated, because only the luckiest samples cross the threshold. This is the "winner's curse" behind much of the replication crisis.
Post-Hoc Power Is Not a Fix
Calculating power after a non-significant result, using the observed effect size, tells you nothing new — it is a deterministic function of the p-value. If you need to say something about a null result, report the confidence interval instead. An interval of −0.2% to +0.4% is an informative null; an interval of −15% to +18% means the study could not answer the question.
Multiple Testing Multiplies Type I Errors
Run one test at α = 0.05 and the false-positive risk is 5%. Run 20 independent tests and the probability of at least one false positive is 1 − 0.95²⁰ = 64%.
| Number of tests | P(at least one false positive) at α = 0.05 |
|---|---|
| 1 | 5% |
| 5 | 23% |
| 10 | 40% |
| 20 | 64% |
| 50 | 92% |
| 100 | 99.4% |
Corrections:
- Bonferroni — test each at α/m. Controls the family-wise error rate, costs power.
- Holm-Bonferroni — a step-down version, uniformly more powerful, same guarantee.
- Benjamini-Hochberg — controls the false discovery rate; the right choice when screening many hypotheses and some false positives are tolerable.
The practical rule is simply to declare how many tests you ran. Subgroup analyses in dashboards are the biggest silent offender — every filter combination someone tries is an unrecorded test.
Diagnostic Testing: The Same Idea, Different Names
In diagnostics and machine learning classification, the same two errors appear under different labels:
| Statistics | Diagnostics | Classification |
|---|---|---|
| Type I error (α) | False positive | 1 − specificity |
| Type II error (β) | False negative | 1 − sensitivity (recall) |
| Power (1 − β) | Sensitivity | Recall |
| 1 − α | Specificity | True negative rate |
Moving a classification threshold is precisely the α/β trade-off, drawn as an ROC curve. And the base rate matters enormously: a test with 99% sensitivity and 99% specificity applied to a condition with 0.1% prevalence produces about 91% false positives among all positive results. That is Bayes' theorem, not a flaw in the test — and it is the reason screening programmes are designed around prevalence rather than accuracy alone.
How to Choose Deliberately
- Name the two costs. What happens if we act on a false effect? What happens if we miss a real one?
- Set α from the first cost. Expensive, hard-to-reverse action means 0.01. Cheap and reversible means 0.05 or 0.10.
- Set the minimum detectable effect from the second. The smallest change that would alter a decision.
- Solve for sample size at the power you need — usually 80% or 90%.
- If the sample is unaffordable, change the design rather than the arithmetic: paired measurements, better instruments, longer observation, or a narrower question.
Step 5 is where most projects quietly cheat by lowering the power target instead. That does not reduce the required sample; it just moves the risk somewhere less visible.
For the mechanics of step 4, see statistical power and effect size and our sample size calculation guide. For the wider context, hypothesis testing in data science. The NIST/SEMATECH e-Handbook has the formal definitions.
A Worked Decision
A manufacturer is deciding whether to switch to a cheaper raw material supplier. The concern is that the new material raises the defect rate, currently 2%.
Type I error: conclude the new supplier is worse when it is not. Cost: staying with the expensive supplier unnecessarily — roughly ₹18 lakh a year in avoidable material cost.
Type II error: conclude the new supplier is fine when it actually raises defects to 3%. Cost: an extra 1% of production scrapped, plus warranty exposure and customer complaints — plausibly ₹60 lakh a year, and a reputational cost that is harder to price.
The Type II error is roughly three times more expensive. That should change the design:
| Parameter | Default | Adjusted for this decision |
|---|---|---|
| α | 0.05 | 0.10 — accept more false alarms |
| Power | 80% | 95% — accept far fewer misses |
| Sample per group | 1,000 | ~2,400 |
The larger sample costs more to collect, and it buys a materially lower chance of the expensive error. That trade is the entire content of a well-designed test, and it is only visible once both costs are written down in the same units.
Note what happened to α. Raising it from 0.05 to 0.10 looks like weakening the test, and against the conventional instinct it is exactly right here: a false alarm costs a third of what a miss costs, so tolerating more false alarms to catch more real problems is the rational direction.
Frequently Asked Questions
What is a Type I error? Rejecting a true null hypothesis — concluding an effect exists when it does not. Its probability is α, conventionally 0.05.
What is a Type II error? Failing to reject a false null hypothesis — missing a real effect. Its probability is β, conventionally targeted at 0.20.
Which is worse? It depends entirely on consequences. In safety and quality work, missing a real problem is usually worse. In publication and expensive rollouts, false positives usually are.
How do I reduce both? Increase the sample size, reduce measurement noise, or use a more efficient design such as paired measurements. Adjusting α alone always trades one for the other.
What is statistical power? The probability of detecting an effect of a specified size when it genuinely exists, equal to 1 − β. Eighty percent is the usual minimum.
Why does α = 0.05 dominate? Historical convention from Fisher's early work, not a mathematical result. It persists because journals and regulators standardised on it.
Does a bigger sample eliminate Type I errors? No. α stays where you set it regardless of sample size. A bigger sample reduces Type II errors, not false alarms.
What is the family-wise error rate? The probability of making at least one Type I error across a set of tests. It rises fast with the number of tests, which is why corrections exist.
Is a non-significant result evidence of no effect? No. It means insufficient evidence. To claim equivalence you need an equivalence test and a pre-specified margin.
Need the statistics done properly? DSTechnoverse runs study design, sample size calculation, hypothesis testing and reporting for research teams, businesses and PhD scholars — in R, Python, SPSS and Stata. We are based in Indore, Madhya Pradesh and work with clients across India. See our statistical research and data analysis and data analytics services, or talk to our team about your study.