
R is the analyst's Swiss army knife: free, endlessly extensible, and fully reproducible. The trade-off is that you write code instead of clicking menus. This guide gets a complete beginner to their first analysis.
Step 1: Install R and RStudio
- R is the engine (from CRAN)
- RStudio is the friendly interface you actually work in
Install both. RStudio gives you a code editor, console, plots, and data viewer in one window.
Step 2: Understand the basics
A few concepts unlock most of R:
- Objects — you store data in named objects:
age <- c(25, 30, 45) - Functions — you do things with functions:
mean(age) - Data frames — your dataset, like a spreadsheet
- Packages — add-on toolkits you install once and load when needed
Step 3: Load your data
Read a CSV file into a data frame:
data <- read.csv("survey.csv")
head(data)      # peek at the first rows
summary(data)   # quick descriptive summary
Step 4: Explore with descriptive statistics
mean(data$age)
sd(data$age)
table(data$gender)
Step 5: Run a test
A t-test comparing two groups:
t.test(score ~ group, data = data)
R prints the statistic, degrees of freedom, p-value, and confidence interval.
Step 6: Visualise
The ggplot2 package produces publication-quality charts:
library(ggplot2)
ggplot(data, aes(x = group, y = score)) + geom_boxplot()
The essential packages to know
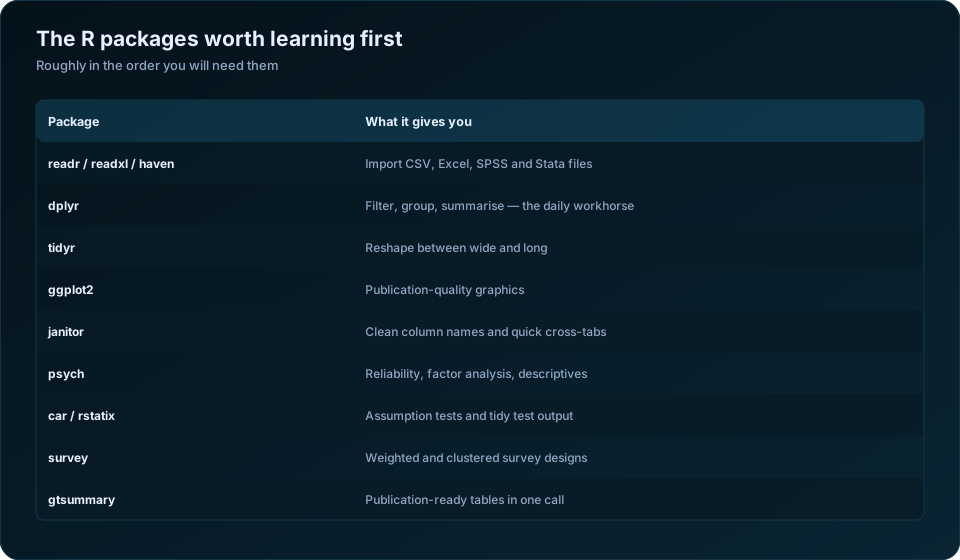
- tidyverse — data manipulation and visualisation (dplyr, ggplot2)
- psych — descriptive stats and reliability
- car — regression diagnostics
- pwr — power and sample size
Why the learning curve is worth it
Because your entire analysis is a script, it is reproducible: re-run it any time, share it, and prove exactly what you did. That transparency is increasingly expected in serious research. Start small, copy examples, and build up — everyone's first R session feels clumsy, and everyone gets past it.
A four-week learning path that works
Most people who abandon R do so in week one, because they tried to learn the language rather than the workflow. This sequence front-loads the things that produce visible results.
| Week | Focus | You should be able to |
|---|---|---|
| 1 | Import and inspect | Read your own SPSS or Excel file, view it, summarise columns |
| 2 | dplyr verbs | Filter rows, select columns, group and summarise, create variables |
| 3 | ggplot2 basics | Produce a bar chart, histogram and scatterplot from your data |
| 4 | Tests and tables | Run your main analysis and export a formatted table |
Learn dplyr before base R subsetting. The pipe-and-verb style reads like a sentence — take the data, filter it, group it, summarise it — and it is how most working R code is written today. Starting with square-bracket indexing is technically more fundamental and considerably more discouraging.
Import from what you already have. Nothing accelerates learning like working on your own dataset from day two. The haven package reads .sav files directly and preserves variable and value labels, so an SPSS user loses nothing in the transition.
The errors every beginner hits, and what they mean
R's error messages are terse. These five account for the majority of early frustration.
| Message | What it actually means | Fix |
|---|---|---|
| object 'x' not found | The variable does not exist in the current environment | Check spelling and case; R is case-sensitive |
| could not find function "select" | The package is not loaded | Run library(dplyr) at the top of the script |
| non-numeric argument to binary operator | You are doing arithmetic on text | The column imported as character; convert it |
| argument is of length zero | Something upstream returned nothing | Check the filter did not remove every row |
| NAs introduced by coercion | Text that could not become a number | Look for stray commas, currency symbols or "NA" as text |
The third and fifth almost always trace to the same cause: a numeric column imported as text because it contained a comma, a rupee symbol, or a "not applicable" entry. Check the type of every column immediately after import — that single habit prevents most of these.
Case sensitivity catches SPSS users constantly. Income, income and INCOME are three different objects in R.
Where R clearly beats point-and-click tools
| Task | Why R wins |
|---|---|
| Repeating an analysis monthly | Re-run one script instead of repeating every dialog |
| Publication-quality figures | ggplot2 controls every element; output is vector, not a screenshot |
| Reshaping wide to long | One tidyr call replaces a fragile manual restructure |
| Merging many files | Loop over a folder rather than opening files by hand |
| Weighted and clustered survey analysis | The survey package handles complex designs properly |
| Reporting that updates with the data | R Markdown or Quarto regenerates the whole document |
| Methods too new for commercial software | A package usually exists within months |
The last two are what convert people permanently. An R Markdown document contains the text, the code and the output together; when next quarter's data arrives you re-knit it and the numbers, tables and charts all update. Anyone who has manually re-pasted forty tables into a report understands why this matters.
The survey package deserves its own mention for anyone doing field research in India. Household surveys almost always involve clustering and weights, and analysing them with ordinary functions produces standard errors that are simply wrong. See sampling methods for household surveys for why.
Set-up choices that matter
| Choice | Recommendation |
|---|---|
| Editor | RStudio, or Positron — do not work in the bare R console |
| Project structure | Use RStudio Projects; never use setwd() with an absolute path |
| Package set | Install the tidyverse in one go rather than piecemeal |
| Script discipline | One script per stage: import, clean, analyse |
| Workspace saving | Turn off "save workspace on exit" — it hides stale objects |
| Reproducibility | Add renv once the project matters |
Turning off workspace saving is the least obvious and most valuable. If R restores your old objects on startup, a script can appear to work while actually depending on a variable created weeks ago and no longer produced by any code. Starting clean forces the script to be complete, which is the entire point of using R in the first place.
What R is not good at
Being honest about this saves people from a frustrating month.
It is slower to reach a first result than SPSS. If you need one t-test by Friday and have never coded, SPSS is the rational choice — see SPSS vs R for data analysis for how that trade-off resolves.
Its default tables are not publication-ready. You need gtsummary or flextable to produce what SPSS gives you out of the box.
Data entry is not its job. Use a proper CAPI tool or a spreadsheet for capture, and bring the file into R for analysis.
And it will not tell you that your method is wrong. R will happily run a t-test on clustered data. The reasoning in how to choose the right statistical test still has to happen in your head.
Free resources worth your time
R for Data Science is the standard free textbook and covers the tidyverse workflow described above. The CRAN Task Views map which packages serve which field, which is the fastest way to find the right tool for a specialised method. For statistics specifically, the psych package documentation covers reliability and factor analysis thoroughly.
For work you would rather hand over, our statistical and research data analysis service works in R and delivers the commented script alongside the results, so the analysis remains yours to re-run and extend.
Frequently Asked Questions
How long does it take to learn R for statistics?
About four weeks to comfortable working use if you practise on your own data — one week each for import and inspection, dplyr, ggplot2, and running tests. Reaching fluency with advanced modelling and package development takes considerably longer.
Is R hard to learn if I have never programmed?
It is harder than SPSS for the first fortnight and easier after the first month. Most social scientists using R had no programming background. Starting with the tidyverse rather than base R makes the early phase substantially gentler.
Can R open SPSS files?
Yes. The haven package reads .sav files directly and preserves variable labels, value labels and missing-value definitions. It also writes .sav files, so you can hand data back to SPSS colleagues without loss.
What R packages should I install first?
The tidyverse collection covers import, manipulation and graphics in one installation. Add psych for reliability and factor analysis, rstatix for tidy test output, survey for complex survey designs, and gtsummary for publication-ready tables.
Why does R say "could not find function"?
The package providing that function is not loaded in the current session. Installing a package is a one-time action; loading it with library() is required every time R restarts. Put your library() calls at the top of every script.
Is R better than Excel for statistics?
For anything beyond simple descriptives, yes. Excel edits leave no record of what changed, which makes the analysis impossible to reproduce or audit. R records every step in a script that can be re-run, reviewed and corrected.
Need help turning your data into defensible results? DSTechnoverse offers statistical and research data analysis services in SPSS, R, and Python — survey analysis, thesis and dissertation support, and business statistics. Get in touch to discuss your dataset.