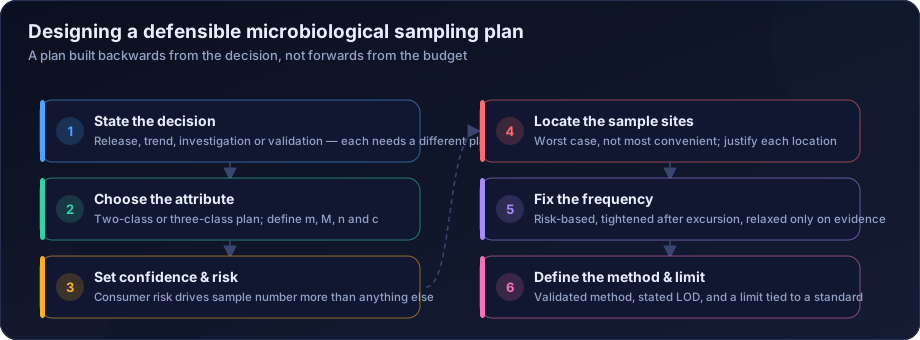
A microbiological sampling plan is a statistical instrument, and most are used well beyond what their statistics support. This article covers how sampling plans work, how to size one for the risk you are actually willing to accept, and how to describe honestly what the resulting data can prove.
The Uncomfortable Arithmetic
Start with the number that reframes everything else. A batch of 50,000 units contains contamination in 1 per cent of units — 500 contaminated units. You test 5.
The probability that all five sampled units are clean is 0.99 to the fifth power, or about 95 per cent. Your test has a 95 per cent chance of declaring the batch clean when 500 contaminated units are present.
Increase to 20 units and the miss probability is still 82 per cent. To detect 1 per cent contamination with 95 per cent confidence you need roughly 300 samples. To detect 0.1 per cent contamination you need roughly 3,000.
No commercial testing programme does this. What follows from that fact is the entire logic of how sampling plans should be designed and interpreted.
What Testing Is Actually For
If end-product testing cannot reliably detect low-level contamination, why do it?
Because it is not the primary control. It is verification that the primary controls — validated process, controlled inputs, monitored environment — are still working. Testing detects systematic failures reliably: a sterilisation cycle that failed, a raw material lot that was heavily contaminated, a water system that has degraded. Those affect a large fraction of units and a modest sample finds them easily.
What testing cannot detect is sporadic contamination affecting a small fraction. That is exactly why process control, not testing, carries the assurance burden.
A manufacturer who understands this designs a good programme. One who does not tests more units and believes the resulting number means more than it does.
Two-Class and Three-Class Attribute Plans
The standard framework, formalised by ICMSF, describes plans using a small set of parameters.
Two-class plans
Used for presence/absence attributes such as Salmonella.
- n — number of sample units tested
- c — maximum number of units allowed to exceed the limit (usually 0)
- m — the limit itself
A plan of n=5, c=0, m=absent in 25 g means: test five units, and if any one contains Salmonella in 25 g, reject.
Three-class plans
Used for counts, where a marginal level is tolerable but a high level is not.
- m — the acceptable level
- M — the level that is unacceptable in any unit
- c — how many units may fall between m and M
A plan of n=5, c=2, m=10³, M=10⁴ CFU/g means: test five, up to two may fall between 1,000 and 10,000, none may exceed 10,000, and any single result above M rejects the lot.
Operating Characteristic Curves
Every sampling plan has an OC curve describing the probability of acceptance at each true contamination level. Reading it is the honest way to understand a plan.
| True defect rate | P(accept), n=5, c=0 | P(accept), n=20, c=0 | P(accept), n=60, c=0 |
|---|---|---|---|
| 0.1% | 99.5% | 98.0% | 94.2% |
| 1% | 95.1% | 81.8% | 54.7% |
| 5% | 77.4% | 35.8% | 4.6% |
| 10% | 59.0% | 12.2% | 0.2% |
| 20% | 32.8% | 1.2% | ~0% |
Two conclusions follow. First, small plans only detect gross contamination. Second, increasing n improves detection at high defect rates far more than at low ones — which is where the practical limit of testing sits.
Designing the Plan: A Working Sequence
-
State the decision. Release, trend monitoring, validation or investigation. Each needs a different plan, and this choice governs everything downstream. It is the step most commonly skipped.
-
Define the hazard and the consumer risk. A ready-to-eat product for immunocompromised patients warrants a far lower acceptable risk than a raw material destined for terminal sterilisation. The risk you accept determines n more than any other factor.
-
Choose the plan class. Two-class for pathogens where any presence is unacceptable. Three-class for indicator counts where a marginal level is tolerable.
-
Set m and M from a standard where one exists. FSSAI category criteria, pharmacopoeial limits or ISO specifications should be the starting point, adjusted upward in stringency where your risk assessment requires.
-
Calculate n from the OC curve, not from convention. If n=5 gives you a 77 per cent chance of accepting a 5 per cent contaminated lot and that is unacceptable, the plan is wrong regardless of what the industry norm is.
-
Locate the samples deliberately. Beginning, middle and end of a fill or compression run detects process drift that a single grab sample cannot. Worst-case locations, not convenient ones.
-
Define the method and its limit of detection. A plan requiring absence in 25 g cannot be executed by a method with a detection limit of 100 CFU/g.
-
Write down what the plan cannot prove. This is the mark of a defensible plan and the thing auditors respect most.
Sampling Location Matters as Much as Sample Count
Where you sample frequently matters more than how many you take, because contamination is rarely uniformly distributed.
- Fill runs — beginning, middle and end capture drift, filter degradation and operator fatigue that a mid-run sample misses entirely.
- Blends and batches — multiple locations within the vessel, since incomplete mixing means a single point is unrepresentative.
- Multi-cavity moulding or multi-head filling — each cavity or head is effectively a separate process and should be sampled as such.
- Environmental sampling — worst case by design; see environmental monitoring.
- Water systems — the whole loop on rotation, not the two most accessible taps.
- Timing — end of campaign or shift, not immediately after cleaning, when the question is about the operating state.
Risk-Based Frequency
Frequency is the other half of the plan and is frequently set by habit.
| Risk class | Example | Frequency | Exit criteria for reduction |
|---|---|---|---|
| High | Botanicals, animal origin, water | Every lot / continuous | 20+ consecutive compliant lots |
| Medium | Starches, packaging, process aids | 1 in 5 lots | Documented supplier history |
| Low | Synthetic APIs, mineral salts | 1 in 20 / CoA review | Verified CoA correlation |
| New supplier | Any class | Every lot | Qualification period complete |
| Post-excursion | Any class | Every lot | Corrective action verified effective |
The principle is that frequency reduction must be earned with evidence, and reversion after any excursion should be automatic rather than debated.
A Worked Example
A cosmetic manufacturer produces 20,000 units per batch of a preserved aqueous cream. The specification requires TAMC below 100 CFU/g and absence of P. aeruginosa in 1 g. Current practice is to test three units from the middle of the fill run.
What that plan can prove. With n=3, a lot with 10 per cent contamination is accepted 73 per cent of the time. A lot with 1 per cent contamination is accepted 97 per cent of the time. The plan reliably detects only gross, near-universal contamination.
What changes with a redesign. Moving to n=10 taken as three from the start, four from the middle and three from the end of the run does two things. It lowers the acceptance probability for a 10 per cent contaminated lot to 35 per cent, and — more importantly — it introduces positional coverage, so filter degradation or equipment warming during the run becomes visible.
What the plan still cannot prove. Even at n=10, a lot with 0.5 per cent contamination is accepted 95 per cent of the time. If the risk assessment says that matters, the answer is not more samples. It is preservative efficacy data, water system control and environmental monitoring — the controls that prevent the contamination rather than the test that looks for it.
That final conclusion is the one worth internalising. When a sampling plan cannot deliver the confidence you need, the correct response is almost always to strengthen the process, not to enlarge the sample.
Sampling Plans for Environmental Monitoring
Environmental monitoring plans follow a different logic from product release plans, because the objective is trend detection rather than lot acceptance.
- Site count matters more than replicate count. Twenty sites sampled once tells you far more about a facility than five sites sampled four times.
- Consistency over time is the primary requirement. A trend only exists if the same locations are sampled the same way on the same schedule.
- Positive-site rate is often more sensitive than magnitude. In low-bioburden environments, the percentage of sites showing any growth detects deterioration earlier than the average count does.
- Frequency should be graded. Grade A and B zones every session; Grade C weekly; Grade D monthly to weekly, adjusted on risk.
- Sampling must occur in the operating state, at the end of a campaign or shift, not immediately after cleaning.
Common Sampling Plan Failures
- Composite sampling used to save cost. Combining ten units into one test dilutes a single contaminated unit tenfold and may push it below the detection limit. Acceptable for some indicator work, dangerous for pathogens.
- Convenience sampling. The units taken are the ones nearest the door.
- No sample from the end of the run. Filter degradation and equipment warming both show up late.
- Testing the same tap every week and calling it water system monitoring.
- Reducing frequency without documented justification, usually during a cost exercise, with no criteria for reverting.
- A plan that has never been revisited despite line changes, new products or a contamination event.
- Stating conclusions the plan cannot support — the failure that turns a technical weakness into a regulatory one.
Documenting the Plan
A defensible sampling plan document states, at minimum: the decision it supports, the hazard, the accepted consumer risk, the plan class and parameters (n, c, m, M), sample locations with justification, timing, frequency with the basis for it, the method and its limit of detection, and an explicit statement of the plan's limitations.
That last element is what most plans omit and what most distinguishes a plan written by someone who understands the statistics from one copied from a template.
How DSTechnoverse Helps
We design sampling plans that state their own limitations, and we say so before the work starts rather than after an auditor points it out. Where a plan cannot support the conclusion a client wants to draw, that is the first thing we tell them.
Our work spans plan design and OC curve analysis, specification setting, method and limit-of-detection matching, risk-based frequency schedules with documented exit criteria, and retrospective review of existing programmes to establish what the historical data can and cannot demonstrate.
Frequently Asked Questions
How many samples do we actually need?
It depends entirely on the contamination rate you need to detect and the confidence you need. To detect 1 per cent contamination with 95 per cent confidence requires roughly 300 samples. Most commercial plans accept far lower confidence, which is defensible — provided it is stated rather than glossed over.
Is composite sampling acceptable?
For indicator organisms and general quality monitoring, often yes. For pathogens, it is risky because dilution can push a single contaminated unit below detection. If used, the dilution effect must be accounted for in the detection limit.
What is the difference between two-class and three-class plans?
Two-class plans handle presence/absence attributes with a single limit. Three-class plans handle counts with an acceptable level (m) and an unacceptable level (M), tolerating a defined number of marginal results.
Can we reduce sampling to cut cost?
Yes, where evidence supports it — a documented supplier history, a validated process, and clear criteria for reverting to full testing. Reducing frequency because of budget pressure alone, without those elements, is the version that appears in inspection findings.
Should the plan change after a contamination event?
Automatically, and it should be written into the procedure rather than decided case by case. Reversion to every-lot testing until corrective action is verified effective is the standard expectation.
How does sampling relate to process validation?
They are complementary and frequently confused. Validation demonstrates the process is capable. Sampling verifies it remains in control. Neither substitutes for the other, and a weak sampling plan on a well-validated process is a much better position than the reverse.
Need microbiological testing backed by a defensible sampling plan? DSTechnoverse provides industrial microbiological testing for pharmaceutical, food, cosmetic and manufacturing operations. We are based in Indore, Madhya Pradesh and serve clients across India — raw materials, in-process, water, environment and finished product against pharmacopoeial and ISO methods. Talk to our microbiology team about your product and specification.
Related services
Related articles
- Anaerobic Microbiological Testing: The Organisms Standard Methods Never See
- ATP Bioluminescence Testing: What It Measures and Where It Belongs
- Botanical Raw Materials: Why Microbial Counts Are High and What to Do About It
- Finished Product Microbiological Release Testing: Specifications, Sampling and What It Proves