
Noise rarely gets the attention that air or water does, but it is a required part of most EIAs — and it trips up teams who treat it as an afterthought. Here is a beginner-friendly overview of noise data analysis and modelling in the EIA context.
The metric that matters: Leq
Environmental noise fluctuates constantly, so a single instantaneous reading is meaningless. Noise assessment uses Leq — the equivalent continuous sound level, the steady level that carries the same energy as the actual fluctuating noise over a period.
Two Leq values dominate EIA work:
- Leq (day) — daytime period
- Leq (night) — nighttime period, with stricter limits because sleep disturbance matters
Standards define separate day and night limits by land-use category (industrial, commercial, residential, and sensitive/silence zones).
Step 1: Baseline monitoring
Ambient noise is measured at representative locations around the site over full day and night periods, capturing existing conditions before the project.
Step 2: Analyse the data
The raw sound-level logs are processed into:
- Day and night Leq values per location
- Often L10, L90, Lmax, Lmin to describe the noise character
- Comparison tables against the applicable ambient noise standards
Step 3: Predict project noise
For the project itself, noise modelling estimates how sound from equipment and operations propagates to surrounding receptors. It accounts for:
- Source sound power levels of major equipment
- Distance attenuation — noise falls off with distance
- Barriers, ground, and air absorption
The predicted contribution is added to the baseline and compared against the standard at each receptor.
Step 4: Assess and mitigate
Where predicted levels approach or exceed limits — especially at night — the assessment considers mitigation: barriers, enclosures, quieter equipment, or operational restrictions.
Common mistakes
- Applying day limits to night-time assessment (or vice versa)
- Using the wrong land-use category for a receptor
- Reporting instantaneous levels instead of Leq
- Forgetting to add project noise to the existing baseline
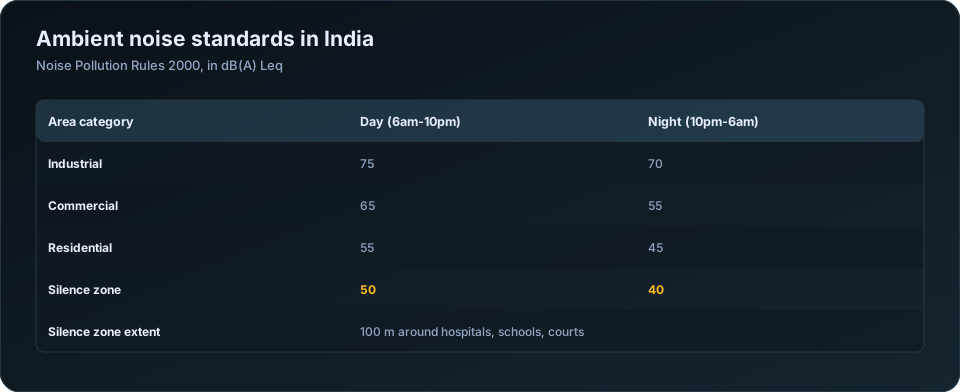
The standards, and the category question that precedes them
| Area category | Day, 6am to 10pm (dB(A) Leq) | Night, 10pm to 6am (dB(A) Leq) |
|---|---|---|
| Industrial | 75 | 70 |
| Commercial | 65 | 55 |
| Residential | 55 | 45 |
| Silence zone | 50 | 40 |
Silence zones extend 100 metres around hospitals, educational institutions and courts, and are notified by the state government.
Before applying any limit, the area category has to be established, and this is where noise chapters most often go wrong. A village adjacent to an industrial estate is residential, not industrial — the category follows the land use at the receptor, not at the source. Applying the 75 dB(A) industrial limit to a settlement outside the plant boundary is a straightforward error that changes the compliance conclusion entirely.
Note also the twenty-decibel range between industrial daytime and silence-zone night limits. Because the scale is logarithmic, that represents a hundredfold difference in sound energy — which is why a single project can be comfortably compliant at its own boundary and clearly non-compliant at a school 300 metres away.
Why noise arithmetic is not ordinary arithmetic
Two machines each producing 80 dB(A) do not produce 160 dB(A). They produce 83.
| Difference between two sources | Add to the louder |
|---|---|
| 0 dB | +3.0 |
| 1 to 2 dB | +2.5 |
| 3 to 4 dB | +2.0 |
| 5 to 6 dB | +1.0 |
| 7 to 9 dB | +0.5 |
| 10 dB or more | +0.0 |
The practical consequence is important for mitigation. If your loudest source is 10 dB above the next, silencing everything else changes almost nothing. Noise control has to address the dominant source first, and modelling is what identifies which source that is at each receptor.
The same logarithmic behaviour governs distance. In free-field conditions a point source loses 6 dB per doubling of distance; a line source such as a road loses only 3 dB. This is why road traffic noise persists so much further from the source than plant noise does, and why highway-adjacent receptors are hard to protect.
Building a noise model
| Input | Detail required |
|---|---|
| Source sound power levels | Per equipment item, from manufacturer data or measurement |
| Source locations and heights | Coordinates in a consistent projection |
| Operating schedule | Which sources run at night — decisive for compliance |
| Enclosure and barrier details | Existing acoustic treatment |
| Terrain | Ground elevation across the study area |
| Ground type | Hard (reflective) or soft (absorptive) |
| Buildings and barriers | Positions and heights for screening |
| Meteorology | Downwind propagation is the standard assessment condition |
| Receptors | Named locations at their real coordinates |
Sound power level, which describes the source, is not sound pressure level, which describes what is measured at a distance. Manufacturer data sheets sometimes give pressure at a stated distance rather than power, and using one where the other is expected produces an error of tens of decibels. Check which is quoted and convert.
The operating schedule is what usually decides the outcome. Night limits are 10 dB stricter than day limits in residential areas, so a plant that runs its noisiest equipment continuously faces a much harder compliance case than one that confines it to daytime. Modelling day and night scenarios separately is essential, not optional.
Models in common use are CadnaA, SoundPLAN and Predictor, most implementing ISO 9613-2 for outdoor propagation.
Baseline noise monitoring
| Element | Requirement |
|---|---|
| Locations | At the site boundary, at the nearest habitations, at sensitive receptors, at a background location |
| Duration | 24 hours per location, covering day and night |
| Measurement | Hourly Leq, with Lmax and L90 also recorded |
| Instrument | Type 1 or Type 2 sound level meter, calibrated before and after |
| Conditions | Wind speed noted; measurements avoided in rain or high wind |
| Source notes | Contemporaneous record of what was audible |
The source notes are the most valuable and most neglected element. A reading of 61 dB(A) means little on its own. "61 dB(A), dominated by traffic on the state highway 200 m east, with intermittent agricultural pumping" is interpretable, and it lets the assessment distinguish an existing traffic environment from a project contribution.
L90 — the level exceeded 90% of the time — is a useful measure of the underlying background beneath intermittent events, and reporting it alongside Leq strengthens the baseline considerably.
Assessing the impact
| Assessment step | Method |
|---|---|
| Predict project-only contribution | Model output at each receptor, day and night |
| Add to measured baseline | Logarithmic addition, not arithmetic |
| Compare against the category limit | Total against the applicable standard |
| Report the increment | Change in dB(A) over baseline |
| Assess construction separately | Different sources, different duration |
| Evaluate mitigation | Re-model with barriers, enclosures or restrictions |
The increment matters independently of the absolute level. A 3 dB rise is at the threshold of perception; 5 dB is clearly noticeable; 10 dB is perceived as roughly a doubling of loudness. A project that keeps a receptor within the limit while raising the level by 9 dB has still changed the acoustic environment materially, and appraisal committees increasingly ask about the increment as well as compliance.
Where baseline is already at or above the limit — common near highways — the assessment must be explicit that the project's increment is being added to an existing exceedance.
Mitigation, ranked by effectiveness
| Measure | Typical reduction |
|---|---|
| Source substitution or specification | 5 to 15 dB |
| Acoustic enclosure of the dominant source | 10 to 25 dB |
| Silencers on fans, vents and exhausts | 10 to 20 dB |
| Barrier or bund between source and receptor | 5 to 15 dB |
| Increasing distance through layout | 6 dB per doubling |
| Restricting night operation | Up to the full night contribution |
| Vegetation belt | 1 to 3 dB — largely visual |
Vegetation is included because it is proposed so frequently and delivers so little. A dense belt tens of metres deep provides a few decibels at best. It has genuine visual and psychological value and should not be presented as an acoustic control.
The effective interventions are at or very near the source. Enclosing the dominant item usually achieves more than every downstream measure combined — which returns to the logarithmic addition point: fix the loudest source first, because until you do, nothing else registers.
For the wider baseline process see EIA baseline data analysis; for outsourcing the processing, EIA data analysis outsourcing. Our EIA data analysis outsourcing service covers noise monitoring analysis and modelling. The Noise Pollution (Regulation and Control) Rules are published by CPCB.
The takeaway
Noise analysis is methodical: correct metrics, correct periods, correct standards. It pairs naturally with air and water work, which is why consultancies often route the whole baseline data package — noise included — to a single EIA data analysis desk for consistent, standards-aligned output.
Frequently Asked Questions
What are the noise standards in India for EIA?
Under the Noise Pollution Rules 2000, ambient limits in dB(A) Leq are 75 day and 70 night for industrial areas, 65 and 55 for commercial, 55 and 45 for residential, and 50 and 40 for silence zones, which extend 100 metres around hospitals, schools and courts.
How do you add noise levels together?
Logarithmically, not arithmetically. Two equal sources add 3 dB, so two 80 dB(A) sources give 83 dB(A). A source 10 dB or more below another adds nothing measurable, which is why noise control must target the dominant source first.
What is the difference between sound power and sound pressure level?
Sound power describes the source's total acoustic output and is what a model requires. Sound pressure is what a meter measures at a given distance. Confusing the two produces errors of tens of decibels, so check which a manufacturer's data sheet quotes.
How is baseline noise monitored for an EIA?
Twenty-four hours per location covering day and night, at the site boundary, nearest habitations, sensitive receptors and a background point, recording hourly Leq along with Lmax and L90, using a calibrated Type 1 or Type 2 meter, with contemporaneous notes on the audible sources.
Which area category applies to a village near an industrial site?
Residential, with 55 dB(A) day and 45 dB(A) night limits. The category follows land use at the receptor, not at the source. Applying the industrial limit to a settlement outside the plant boundary is a common and consequential error.
Do trees reduce noise?
Only marginally — a dense belt tens of metres deep gives perhaps one to three decibels. Vegetation has real visual and psychological value but should not be presented as an acoustic mitigation measure. Source enclosure and silencers deliver ten to twenty-five decibels.
Need a modelling or EIA data desk without the overhead? DSTechnoverse works as a confidential, white-label subcontractor for air and water dispersion modelling and EIA data analysis. Get in touch to scope your next project.