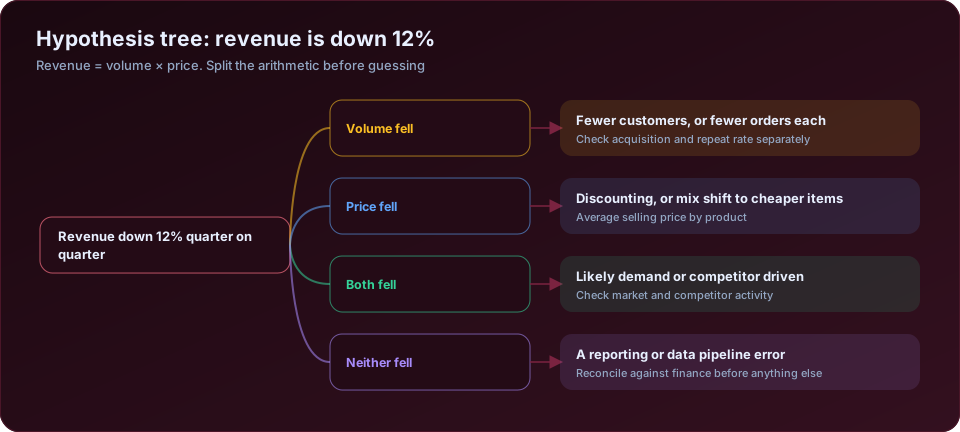
A hypothesis tree turns an unbounded question — "why did revenue fall?" — into a finite set of testable branches. It is the single most useful structuring tool in business analysis, and it is usually built wrong.
What It Is
A hypothesis tree starts with the problem at the root and breaks it into possible explanations, each broken down further, until every branch is something you can test with available data.
Two properties make it work:
MECE — mutually exclusive, collectively exhaustive. Branches must not overlap, and together must cover every possibility. Overlap means you test the same thing twice and can double-count a cause; a gap means the real cause may not appear anywhere on the tree.
Testable leaves. Every terminal branch must be checkable against data. "Customers are less satisfied" is not testable as written. "Repeat purchase rate among customers acquired before January fell from 34% to 22%" is.
Start With the Arithmetic
The most reliable way to build a MECE tree is to decompose the metric mathematically before speculating about causes. Arithmetic is automatically mutually exclusive and exhaustive — the components must sum to the whole.
Revenue = Volume × Price
That single split gives four branches at the top level, and they are genuinely exhaustive:
| Branch | Meaning | First check |
|---|---|---|
| Volume fell, price flat | Fewer units sold | Order count, customer count |
| Price fell, volume flat | Lower realised price | Average selling price, discount rate |
| Both fell | Demand or competitive pressure | Market and competitor data |
| Neither fell | The arithmetic does not reconcile | A data or reporting error |
That fourth branch catches reporting problems, which are common enough to deserve their own place on every tree rather than being discovered three weeks in.
Continue decomposing:
Volume = Customers × Orders per customer Customers = New customers + Returning customers New customers = Traffic × Conversion rate Returning customers = Prior customers × Retention rate
Now the tree has specific, measurable leaves: traffic, conversion, retention, order frequency, average selling price. Each is a number you can pull and compare against its own history.
A Worked Tree
Root: revenue down 12% quarter on quarter.
Branch 1 — Volume fell
- Fewer customers
- Fewer new customers: traffic down? conversion down?
- Fewer returning customers: retention down? cohort effect?
- Fewer orders per customer
- Purchase frequency down
- Basket size down
Branch 2 — Price fell
- More discounting: promotion calendar, discount depth
- Mix shift to cheaper products: revenue by SKU tier
- Channel mix shift: share moving to a lower-price channel
Branch 3 — Both fell
- Market contraction: category data, competitor signals
- Competitor action: pricing, new entrant, campaign
- Macro or seasonal: compare against the same quarter last year
Branch 4 — Neither fell (data error)
- Definition change: revenue recognition, tax treatment
- Pipeline failure: missing loads, duplicated records
- Reconciliation gap against finance
Now test in order of likelihood × cheapness. Branch 4 is usually the cheapest to check — a reconciliation takes an hour — and eliminating it costs almost nothing.
Prioritising Branches
Do not test left to right. Score each branch:
| Criterion | Question |
|---|---|
| Likelihood | How plausible, given what changed and what we know? |
| Cost to test | Hours or days? Data at hand or a new collection? |
| Impact if true | Would this explain the whole movement or a tenth of it? |
| Actionability | If confirmed, could we do anything about it? |
Test high-likelihood, low-cost branches first. A branch you can eliminate in an hour is worth checking even at low likelihood, purely to narrow the space.
The trap to avoid is spending three days on the branch that is most interesting — usually a strategic hypothesis about market dynamics — while the ten-minute reconciliation check that would have found a broken data pipeline goes unrun.
Two Structural Mistakes
Mistake 1: branches that are causes, not components.
A tree whose top level is "marketing problem / sales problem / product problem" is not MECE and not arithmetic. Those categories overlap heavily — a lead quality issue is simultaneously marketing and sales — and nothing forces them to be exhaustive.
Decompose the metric first, then attach causes to the specific component that moved. Once you know conversion fell and traffic held, you have a much narrower and better-posed question.
Mistake 2: leaves you cannot test.
"Brand perception has weakened" may be true and cannot be checked this week with data you have. If a leaf is untestable, either replace it with a measurable proxy — branded search volume, direct traffic share, NPS trend — or move it to a parked list and note that the tree does not cover it.
An untested leaf that stays on the tree gives false comfort that the space was covered.
Trees for Other Problems
Cost increase: Cost = Unit cost × Volume. Then unit cost by input category, volume by driver. Mix shift is the branch most often missed — total cost can rise with every unit cost flat.
Churn: Churn = customers lost / customers at start. Decompose by cohort, by tenure band, by segment, by cause of departure. Concentration usually appears fast — see why customers churn.
Missed project deadline: Delay = scope change + estimation error + resource shortfall + dependency delay. Each is separately measurable against the plan.
Declining conversion: Conversion = sum of step-through rates. Decompose by funnel step; the drop is nearly always one step, not the whole funnel.
Support volume increase: Volume = contacts per customer × customers. Then contacts by reason code — a Pareto analysis on the reason codes usually points straight at the change that caused it.
Using It in a Team
The tree's second function is coordination. It turns "everyone look into the revenue drop" into assigned, non-overlapping work.
- Build the tree together, in one session. Structuring is where the disagreements are, and resolving them early prevents duplicated analysis.
- Assign owners per branch, with a deadline and a stated deliverable.
- Record findings on the tree itself — eliminated, confirmed, partial, untested — so status is visible at a glance.
- Reconvene when branches report, not when everything is finished. An early confirmation redirects the whole effort.
- Keep the tree after the diagnosis. The next similar problem starts from a structure that already exists.
The technique comes out of management consulting, where it is the standard method for structuring an unfamiliar problem quickly, and it survives that origin because it does one thing well: it makes the analysis auditable. Anyone can look at the tree and ask "what about X?" — and either X is on it, or the tree needs another branch.
Recording Progress on the Tree
A tree is also a status document, and treating it as one is what keeps a multi-person diagnosis from drifting.
Annotate each branch as it is tested:
| Status | Meaning | What happens next |
|---|---|---|
| Eliminated | Data shows this is not a contributor | Stop; record the evidence |
| Confirmed | Data shows this explains part or all of the movement | Quantify the contribution |
| Partial | Contributes, but does not explain the whole | Keep other branches open |
| Untested | Not yet examined | Assign an owner and a date |
| Untestable | No data available | Note explicitly; do not silently drop |
The partial status is the one teams handle worst. Finding a real cause that explains a third of the movement feels like success, and the investigation frequently stops there — leaving two thirds unexplained and the fix underpowered.
The discipline that prevents it: reconcile the contributions against the total. If revenue fell 12% and your confirmed causes account for 4 points, 8 points remain unexplained and the diagnosis is not finished. Writing the arithmetic on the tree makes the gap impossible to overlook.
The untestable status matters for a different reason. A branch nobody could check is not evidence of absence, and recording it honestly prevents the report from implying a completeness the analysis did not have.
Frequently Asked Questions
What is a hypothesis tree? A structured breakdown of a problem into possible explanations, each decomposed until every branch can be tested against data.
What does MECE mean? Mutually exclusive, collectively exhaustive — branches must not overlap and together must cover all possibilities.
How is it different from a fishbone diagram? A fishbone organises contributing factors by category. A hypothesis tree decomposes the metric itself, usually arithmetically, which makes it easier to keep exhaustive.
How many levels should a tree have? As many as needed for the leaves to be testable — usually three or four.
What if my branches overlap? Rebuild from an arithmetic decomposition. Overlap almost always means you started from causes rather than from components of the metric.
Which branch should I test first? The one with the best combination of high likelihood, low cost to test, and large explanatory impact.
What if none of the branches is confirmed? Either the tree was not exhaustive — add the missing branch — or the effect is spread thinly across several branches, none large enough to stand out on its own.
Can I use this for non-financial problems? Yes. Anything that decomposes — quality defects, delivery delays, attrition, support volume — works the same way.
Is this the same as an issue tree? Broadly. Issue trees decompose questions; hypothesis trees decompose candidate answers. In practice most people use the terms interchangeably.
Something in the business is off and nobody can say why? DSTechnoverse runs diagnostic analytics engagements — segmenting the problem, testing hypotheses against your data, and finding the cause rather than the symptom. We are based in Indore, Madhya Pradesh and work with businesses across India. See our data analytics and BI implementation services, or talk to our team about what changed.